|
Download Data (XLS File) |
|
||||||||
|
||||||||
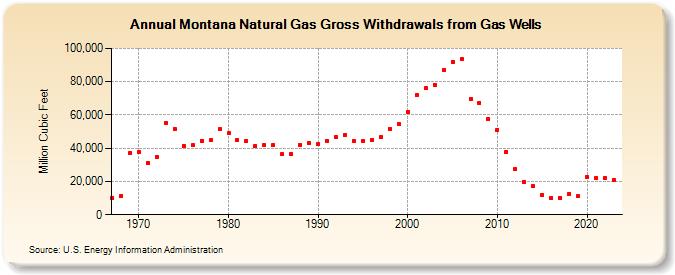
| Montana Natural Gas Gross Withdrawals from Gas Wells (Million Cubic Feet) | ||||||||
| Decade | Year-0 | Year-1 | Year-2 | Year-3 | Year-4 | Year-5 | Year-6 | Year-7 | Year-8 | Year-9 |
|---|---|---|---|---|---|---|---|---|---|---|
| 1960's | 10,308 | 11,208 | 37,163 | |||||||
| 1970's | 37,684 | 31,195 | 34,958 | 55,329 | 51,644 | 41,474 | 41,685 | 44,502 | 44,656 | 51,528 |
| 1980's | 48,929 | 44,837 | 44,283 | 41,456 | 41,774 | 41,816 | 36,296 | 36,556 | 42,066 | 42,985 |
| 1990's | 42,369 | 44,449 | 46,918 | 48,187 | 44,350 | 44,370 | 45,154 | 46,613 | 51,774 | 54,487 |
| 2000's | 61,974 | 71,985 | 76,053 | 78,175 | 87,292 | 91,833 | 93,759 | 69,741 | 67,399 | 57,396 |
| 2010's | 51,117 | 37,937 | 27,518 | 19,831 | 17,015 | 12,090 | 10,219 | 10,283 | 12,751 | 11,020 |
| 2020's | 22,811 | 21,819 | 22,080 | 21,204 | 19,604 |
| - = No Data Reported; -- = Not Applicable; NA = Not Available; W = Withheld to avoid disclosure of individual company data. |
| Release Date: 6/30/2026 |
| Next Release Date: 7/31/2026 |