|
Download Data (XLS File) |
|
||||||||
|
||||||||
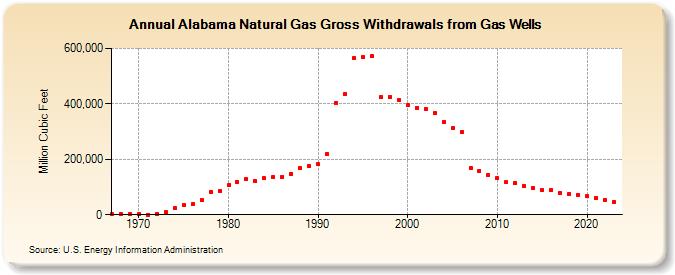
| Alabama Natural Gas Gross Withdrawals from Gas Wells (Million Cubic Feet) | ||||||||
| Decade | Year-0 | Year-1 | Year-2 | Year-3 | Year-4 | Year-5 | Year-6 | Year-7 | Year-8 | Year-9 |
|---|---|---|---|---|---|---|---|---|---|---|
| 1960's | 1,298 | 907 | 1,794 | |||||||
| 1970's | 1,406 | 2 | 2,601 | 8,148 | 23,970 | 33,660 | 37,832 | 54,844 | 83,025 | 83,902 |
| 1980's | 105,447 | 119,662 | 128,208 | 120,717 | 130,872 | 136,864 | 137,202 | 148,238 | 168,484 | 174,345 |
| 1990's | 181,324 | 218,145 | 403,848 | 435,066 | 566,141 | 568,190 | 570,907 | 424,625 | 426,056 | 413,488 |
| 2000's | 394,835 | 385,915 | 380,700 | 365,330 | 333,583 | 311,479 | 299,685 | 168,528 | 158,964 | 142,509 |
| 2010's | 131,448 | 116,872 | 114,407 | 102,842 | 95,774 | 89,295 | 88,469 | 78,796 | 75,326 | 72,500 |
| 2020's | 65,788 | 61,097 | 53,840 | 48,422 | 41,359 |
| - = No Data Reported; -- = Not Applicable; NA = Not Available; W = Withheld to avoid disclosure of individual company data. |
| Release Date: 6/30/2026 |
| Next Release Date: 7/31/2026 |