|
Download Data (XLS File) |
|
||||||||
|
||||||||
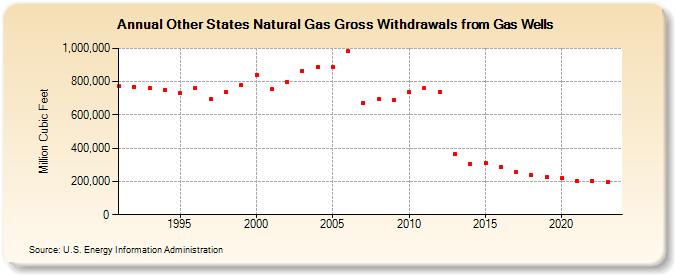
| Other States Natural Gas Gross Withdrawals from Gas Wells (Million Cubic Feet) | ||||||||
| Decade | Year-0 | Year-1 | Year-2 | Year-3 | Year-4 | Year-5 | Year-6 | Year-7 | Year-8 | Year-9 |
|---|---|---|---|---|---|---|---|---|---|---|
| 1990's | 773,234 | 769,516 | 759,423 | 750,143 | 730,223 | 763,244 | 697,181 | 737,041 | 778,833 | |
| 2000's | 842,488 | 754,609 | 797,689 | 863,197 | 886,763 | 887,687 | 981,732 | 671,816 | 693,088 | 690,359 |
| 2010's | 736,257 | 758,992 | 740,403 | 362,605 | 306,487 | 310,894 | 285,280 | 257,963 | 238,520 | 224,222 |
| 2020's | 221,440 | 200,894 | 203,635 | 171,209 | 160,101 |
| - = No Data Reported; -- = Not Applicable; NA = Not Available; W = Withheld to avoid disclosure of individual company data. |
| Release Date: 7/31/2026 |
| Next Release Date: 8/31/2026 |