|
Download Data (XLS File) |
|
||||||||
|
||||||||
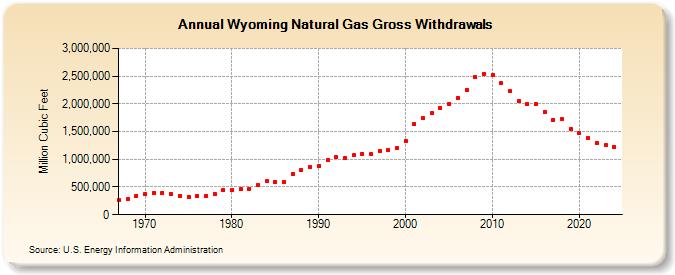
| Wyoming Natural Gas Gross Withdrawals (Million Cubic Feet) | ||||||||
| Decade | Year-0 | Year-1 | Year-2 | Year-3 | Year-4 | Year-5 | Year-6 | Year-7 | Year-8 | Year-9 |
|---|---|---|---|---|---|---|---|---|---|---|
| 1960's | 257,965 | 283,916 | 342,998 | |||||||
| 1970's | 365,502 | 392,011 | 391,847 | 376,992 | 344,555 | 326,238 | 336,833 | 345,042 | 372,310 | 440,014 |
| 1980's | 450,553 | 455,353 | 465,143 | 539,774 | 600,138 | 597,896 | 596,978 | 733,478 | 810,753 | 865,961 |
| 1990's | 883,713 | 978,478 | 1,036,817 | 1,022,602 | 1,070,862 | 1,100,113 | 1,090,549 | 1,153,115 | 1,161,447 | 1,200,238 |
| 2000's | 1,326,042 | 1,634,987 | 1,747,476 | 1,836,115 | 1,929,040 | 2,003,826 | 2,111,766 | 2,257,884 | 2,488,267 | 2,536,336 |
| 2010's | 2,514,657 | 2,375,301 | 2,225,622 | 2,047,757 | 1,998,505 | 1,995,920 | 1,848,623 | 1,715,732 | 1,720,897 | 1,547,504 |
| 2020's | 1,472,873 | 1,375,454 | 1,298,566 | 1,310,060 | 1,343,290 | 1,197,527 |
| - = No Data Reported; -- = Not Applicable; NA = Not Available; W = Withheld to avoid disclosure of individual company data. |
| Release Date: 6/30/2026 |
| Next Release Date: 7/31/2026 |