|
Download Data (XLS File) |
|
||||||||
|
||||||||
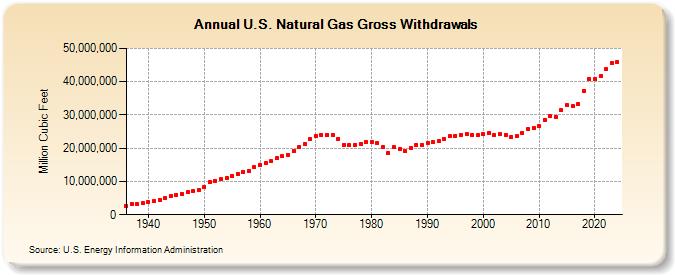
| U.S. Natural Gas Gross Withdrawals (Million Cubic Feet) | ||||||||
| Decade | Year-0 | Year-1 | Year-2 | Year-3 | Year-4 | Year-5 | Year-6 | Year-7 | Year-8 | Year-9 |
|---|---|---|---|---|---|---|---|---|---|---|
| 1930's | 2,691,512 | 3,084,567 | 3,108,858 | 3,387,095 | ||||||
| 1940's | 3,752,702 | 4,168,116 | 4,525,095 | 5,024,449 | 5,708,288 | 6,000,161 | 6,293,037 | 6,733,230 | 7,178,777 | 7,546,825 |
| 1950's | 8,479,650 | 9,689,372 | 10,272,566 | 10,645,798 | 10,984,850 | 11,719,794 | 12,372,905 | 12,906,669 | 13,146,635 | 14,229,272 |
| 1960's | 15,087,911 | 15,460,312 | 16,038,973 | 16,973,368 | 17,535,553 | 17,963,100 | 19,033,839 | 20,251,776 | 21,325,000 | 22,679,195 |
| 1970's | 23,786,453 | 24,088,031 | 24,016,109 | 24,067,202 | 22,849,793 | 21,103,530 | 20,943,778 | 21,097,071 | 21,308,815 | 21,883,353 |
| 1980's | 21,869,692 | 21,587,453 | 20,272,254 | 18,659,046 | 20,266,522 | 19,606,699 | 19,130,711 | 20,140,200 | 20,999,255 | 21,074,425 |
| 1990's | 21,522,622 | 21,750,108 | 22,132,249 | 22,725,642 | 23,580,706 | 23,743,628 | 24,113,536 | 24,212,677 | 24,108,128 | 23,822,711 |
| 2000's | 24,173,875 | 24,500,779 | 23,941,279 | 24,118,978 | 23,969,678 | 23,456,822 | 23,535,018 | 24,663,656 | 25,636,257 | 26,056,893 |
| 2010's | 26,816,085 | 28,479,026 | 29,542,313 | 29,522,551 | 31,405,381 | 32,914,647 | 32,591,578 | 33,292,113 | 37,325,539 | 40,780,210 |
| 2020's | 40,729,927 | 41,676,743 | 43,700,928 | 45,399,670 | 45,867,761 | 47,733,887 |
| - = No Data Reported; -- = Not Applicable; NA = Not Available; W = Withheld to avoid disclosure of individual company data. |
| Release Date: 6/30/2026 |
| Next Release Date: 7/31/2026 |