|
Download Data (XLS File) |
|
||||||||
|
||||||||
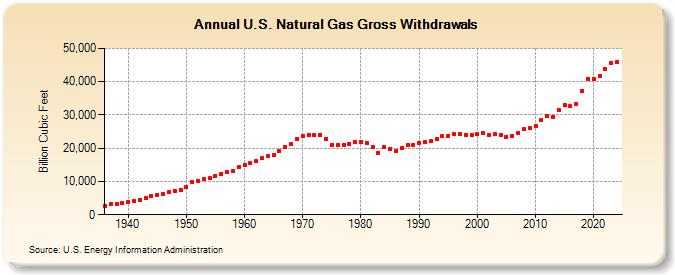
| U.S. Natural Gas Gross Withdrawals (Billion Cubic Feet) | ||||||||
| Decade | Year-0 | Year-1 | Year-2 | Year-3 | Year-4 | Year-5 | Year-6 | Year-7 | Year-8 | Year-9 |
|---|---|---|---|---|---|---|---|---|---|---|
| 1930's | 2,692 | 3,085 | 3,109 | 3,387 | ||||||
| 1940's | 3,753 | 4,168 | 4,525 | 5,024 | 5,708 | 6,000 | 6,293 | 6,733 | 7,179 | 7,547 |
| 1950's | 8,480 | 9,689 | 10,273 | 10,646 | 10,985 | 11,720 | 12,373 | 12,907 | 13,147 | 14,229 |
| 1960's | 15,088 | 15,460 | 16,039 | 16,973 | 17,536 | 17,963 | 19,034 | 20,252 | 21,325 | 22,679 |
| 1970's | 23,786 | 24,088 | 24,016 | 24,067 | 22,850 | 21,104 | 20,944 | 21,097 | 21,309 | 21,883 |
| 1980's | 21,870 | 21,587 | 20,272 | 18,659 | 20,267 | 19,607 | 19,131 | 20,140 | 20,999 | 21,074 |
| 1990's | 21,523 | 21,750 | 22,132 | 22,726 | 23,581 | 23,744 | 24,114 | 24,213 | 24,108 | 23,823 |
| 2000's | 24,174 | 24,501 | 23,941 | 24,119 | 23,970 | 23,457 | 23,535 | 24,664 | 25,636 | 26,057 |
| 2010's | 26,816 | 28,479 | 29,542 | 29,523 | 31,405 | 32,915 | 32,592 | 33,292 | 37,326 | 40,780 |
| 2020's | 40,730 | 41,677 | 43,701 | 45,400 | 45,868 | 47,734 |
| - = No Data Reported; -- = Not Applicable; NA = Not Available; W = Withheld to avoid disclosure of individual company data. |
| Release Date: 6/30/2026 |
| Next Release Date: 7/31/2026 |