|
Download Data (XLS File) |
|
||||||||
|
||||||||
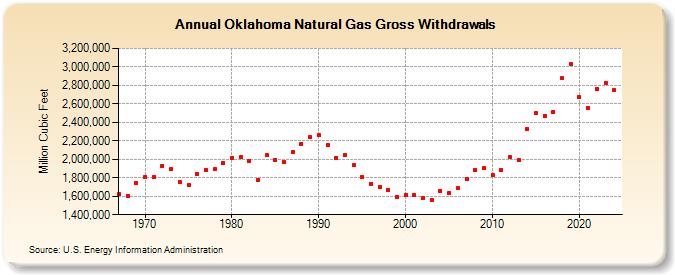
| Oklahoma Natural Gas Gross Withdrawals (Million Cubic Feet) | ||||||||
| Decade | Year-0 | Year-1 | Year-2 | Year-3 | Year-4 | Year-5 | Year-6 | Year-7 | Year-8 | Year-9 |
|---|---|---|---|---|---|---|---|---|---|---|
| 1960's | 1,621,336 | 1,606,577 | 1,741,677 | |||||||
| 1970's | 1,811,004 | 1,809,086 | 1,927,949 | 1,889,787 | 1,756,629 | 1,720,698 | 1,842,189 | 1,888,070 | 1,892,413 | 1,958,337 |
| 1980's | 2,018,577 | 2,019,199 | 1,985,384 | 1,779,541 | 2,046,339 | 1,993,405 | 1,971,988 | 2,073,461 | 2,167,050 | 2,237,037 |
| 1990's | 2,258,471 | 2,153,852 | 2,017,356 | 2,049,942 | 1,934,864 | 1,811,734 | 1,734,887 | 1,703,888 | 1,669,367 | 1,594,002 |
| 2000's | 1,612,890 | 1,615,384 | 1,581,606 | 1,558,155 | 1,655,769 | 1,639,310 | 1,688,985 | 1,783,682 | 1,886,710 | 1,901,556 |
| 2010's | 1,827,328 | 1,888,870 | 2,023,461 | 1,993,754 | 2,331,086 | 2,499,599 | 2,468,312 | 2,513,897 | 2,875,787 | 3,036,052 |
| 2020's | 2,673,207 | 2,555,430 | 2,763,069 | 2,759,502 | 2,750,607 | 2,877,738 |
| - = No Data Reported; -- = Not Applicable; NA = Not Available; W = Withheld to avoid disclosure of individual company data. |
| Release Date: 5/29/2026 |
| Next Release Date: 6/30/2026 |