|
Download Data (XLS File) |
|
||||||||
|
||||||||
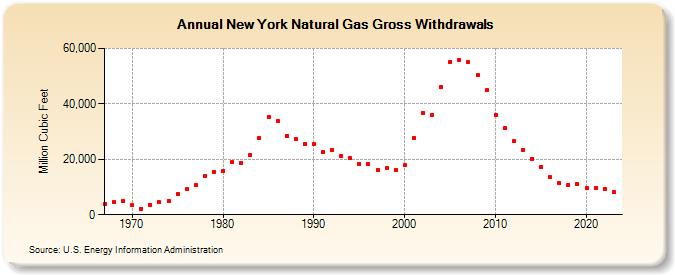
| New York Natural Gas Gross Withdrawals (Million Cubic Feet) | ||||||||
| Decade | Year-0 | Year-1 | Year-2 | Year-3 | Year-4 | Year-5 | Year-6 | Year-7 | Year-8 | Year-9 |
|---|---|---|---|---|---|---|---|---|---|---|
| 1960's | 3,837 | 4,632 | 4,861 | |||||||
| 1970's | 3,358 | 2,202 | 3,679 | 4,539 | 4,990 | 7,628 | 9,235 | 10,682 | 13,900 | 15,500 |
| 1980's | 15,650 | 19,000 | 18,760 | 21,580 | 27,600 | 35,334 | 33,684 | 28,478 | 27,467 | 25,469 |
| 1990's | 25,398 | 22,778 | 23,521 | 21,197 | 20,476 | 18,400 | 18,134 | 16,193 | 16,704 | 16,127 |
| 2000's | 17,757 | 27,787 | 36,816 | 36,137 | 46,050 | 55,180 | 55,980 | 54,942 | 50,320 | 44,849 |
| 2010's | 35,813 | 31,124 | 26,424 | 23,458 | 20,201 | 17,325 | 13,523 | 11,395 | 10,653 | 10,962 |
| 2020's | 9,657 | 9,708 | 9,441 | 8,336 | 8,836 |
| - = No Data Reported; -- = Not Applicable; NA = Not Available; W = Withheld to avoid disclosure of individual company data. |
| Release Date: 6/30/2026 |
| Next Release Date: 7/31/2026 |