|
Download Data (XLS File) |
|
||||||||
|
||||||||
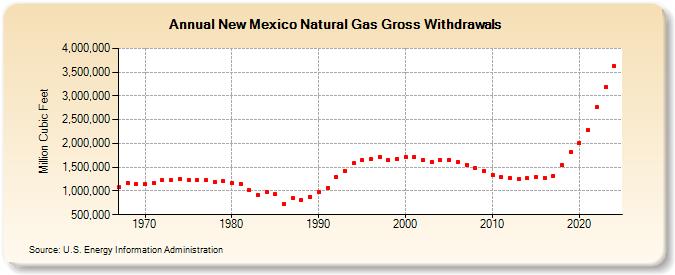
| New Mexico Natural Gas Gross Withdrawals (Million Cubic Feet) | ||||||||
| Decade | Year-0 | Year-1 | Year-2 | Year-3 | Year-4 | Year-5 | Year-6 | Year-7 | Year-8 | Year-9 |
|---|---|---|---|---|---|---|---|---|---|---|
| 1960's | 1,075,010 | 1,170,524 | 1,142,594 | |||||||
| 1970's | 1,141,889 | 1,170,400 | 1,221,757 | 1,223,562 | 1,254,299 | 1,227,200 | 1,239,652 | 1,222,870 | 1,198,593 | 1,200,469 |
| 1980's | 1,168,049 | 1,153,163 | 1,009,883 | 917,158 | 978,236 | 926,174 | 721,217 | 845,478 | 811,994 | 878,080 |
| 1990's | 984,679 | 1,058,619 | 1,289,780 | 1,430,331 | 1,581,797 | 1,640,878 | 1,664,676 | 1,717,468 | 1,647,925 | 1,673,817 |
| 2000's | 1,713,706 | 1,712,390 | 1,655,906 | 1,616,179 | 1,644,738 | 1,656,850 | 1,619,528 | 1,555,450 | 1,487,123 | 1,425,222 |
| 2010's | 1,341,475 | 1,287,682 | 1,276,296 | 1,247,394 | 1,266,379 | 1,296,793 | 1,282,666 | 1,323,019 | 1,540,984 | 1,818,227 |
| 2020's | 2,005,518 | 2,277,035 | 2,763,663 | 3,194,364 | 3,616,820 | 4,150,524 |
| - = No Data Reported; -- = Not Applicable; NA = Not Available; W = Withheld to avoid disclosure of individual company data. |
| Release Date: 7/31/2026 |
| Next Release Date: 8/31/2026 |