|
Download Data (XLS File) |
|
||||||||
|
||||||||
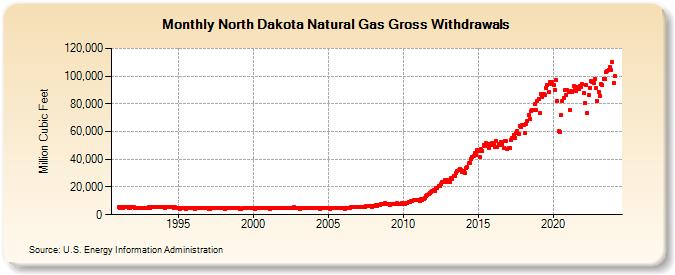
| North Dakota Natural Gas Gross Withdrawals (Million Cubic Feet) | ||||||||
| Year | Jan | Feb | Mar | Apr | May | Jun | Jul | Aug | Sep | Oct | Nov | Dec |
|---|---|---|---|---|---|---|---|---|---|---|---|---|
| 1991 | 5,413 | 4,886 | 5,408 | 5,186 | 5,231 | 5,259 | 5,595 | 5,337 | 4,737 | 4,987 | 5,214 | 5,404 |
| 1992 | 5,278 | 4,889 | 5,203 | 4,783 | 4,881 | 4,865 | 5,024 | 5,049 | 4,841 | 5,203 | 4,900 | 5,063 |
| 1993 | 5,424 | 5,010 | 5,517 | 5,467 | 5,533 | 5,365 | 5,541 | 5,541 | 5,308 | 5,388 | 5,318 | 5,539 |
| 1994 | 5,466 | 5,014 | 5,459 | 5,418 | 5,580 | 5,282 | 5,365 | 5,271 | 4,982 | 5,325 | 5,086 | 4,984 |
| 1995 | 4,914 | 4,461 | 5,009 | 4,730 | 4,857 | 4,770 | 4,333 | 4,854 | 4,711 | 4,828 | 4,579 | 4,628 |
| 1996 | 4,748 | 4,307 | 4,643 | 4,541 | 4,757 | 4,542 | 4,622 | 4,714 | 4,740 | 4,819 | 4,658 | 4,627 |
| 1997 | 4,297 | 4,255 | 4,754 | 4,650 | 4,847 | 4,666 | 4,696 | 4,810 | 4,755 | 4,850 | 4,765 | 4,949 |
| 1998 | 4,935 | 4,344 | 4,683 | 4,694 | 4,952 | 4,768 | 4,900 | 4,976 | 4,750 | 4,943 | 4,814 | 4,855 |
| 1999 | 4,644 | 4,132 | 4,478 | 4,510 | 4,554 | 4,548 | 4,816 | 4,857 | 4,670 | 4,845 | 4,741 | 4,840 |
| 2000 | 4,815 | 4,339 | 4,522 | 4,520 | 4,805 | 4,598 | 4,802 | 4,652 | 4,630 | 4,831 | 4,497 | 4,778 |
| 2001 | 4,795 | 4,267 | 4,831 | 4,827 | 5,077 | 4,626 | 4,947 | 5,044 | 4,759 | 4,849 | 4,936 | 5,029 |
| 2002 | 5,000 | 4,513 | 4,937 | 4,870 | 5,169 | 4,878 | 5,040 | 5,132 | 5,536 | 5,097 | 4,849 | 4,957 |
| 2003 | 4,821 | 4,305 | 4,757 | 4,502 | 4,688 | 4,776 | 4,918 | 4,927 | 4,965 | 5,009 | 5,044 | 5,174 |
| 2004 | 5,154 | 4,688 | 5,076 | 4,709 | 4,588 | 4,427 | 4,601 | 4,693 | 4,787 | 4,913 | 4,821 | 4,876 |
| 2005 | 4,708 | 4,327 | 4,928 | 4,661 | 4,739 | 4,588 | 4,619 | 4,697 | 4,515 | 4,771 | 4,634 | 4,717 |
| 2006 | 4,909 | 4,331 | 4,969 | 4,946 | 5,178 | 5,077 | 5,281 | 5,393 | 5,470 | 5,780 | 5,561 | 5,891 |
| 2007 | 5,793 | 5,272 | 5,743 | 5,679 | 5,915 | 5,813 | 6,080 | 6,310 | 6,062 | 6,285 | 6,195 | 5,650 |
| 2008 | 6,468 | 6,012 | 6,659 | 6,635 | 7,192 | 7,303 | 7,529 | 7,718 | 7,798 | 8,276 | 8,082 | 7,516 |
| 2009 | 7,481 | 6,809 | 7,582 | 7,512 | 7,662 | 7,472 | 7,989 | 8,144 | 7,789 | 7,911 | 8,016 | 8,122 |
| 2010 | 7,814 | 7,615 | 8,641 | 8,474 | 9,357 | 9,163 | 10,035 | 10,246 | 10,290 | 10,791 | 10,798 | 10,643 |
| 2011 | 10,533 | 9,580 | 11,152 | 10,775 | 11,298 | 11,912 | 13,454 | 14,457 | 14,745 | 15,973 | 16,030 | 17,115 |
| 2012 | 17,725 | 17,013 | 19,214 | 19,226 | 21,030 | 21,016 | 22,304 | 23,614 | 23,913 | 24,752 | 23,445 | 25,315 |
| 2013 | 24,554 | 23,370 | 26,236 | 25,836 | 27,899 | 28,004 | 30,134 | 31,247 | 31,972 | 33,242 | 32,558 | 30,737 |
| 2014 | 31,460 | 29,785 | 33,785 | 34,177 | 37,055 | 37,621 | 40,126 | 41,826 | 42,687 | 44,551 | 43,146 | 46,996 |
| 2015 | 45,741 | 41,448 | 47,329 | 46,025 | 50,375 | 49,649 | 51,399 | 50,978 | 48,122 | 51,373 | 50,340 | 51,854 |
| 2016 | 50,905 | 49,040 | 53,093 | 48,915 | 51,010 | 49,945 | 52,657 | 50,847 | 48,416 | 53,354 | 52,901 | 47,767 |
| 2017 | 48,478 | 48,103 | 53,894 | 55,192 | 57,609 | 55,675 | 58,918 | 60,597 | 58,407 | 64,060 | 62,978 | 64,688 |
| 2018 | 64,383 | 59,004 | 65,768 | 67,296 | 71,777 | 69,003 | 74,479 | 75,712 | 75,796 | 79,628 | 75,723 | 82,248 |
| 2019 | 83,691 | 73,128 | 86,896 | 84,797 | 87,299 | 86,615 | 91,369 | 93,505 | 88,519 | 95,528 | 94,336 | 95,408 |
| 2020 | 93,676 | 90,295 | 97,365 | 81,901 | 60,074 | 59,514 | 71,716 | 82,017 | 84,433 | 89,644 | 86,724 | 89,619 |
| 2021 | 88,401 | 75,815 | 88,928 | 88,586 | 92,738 | 89,863 | 89,324 | 91,906 | 90,662 | 92,958 | 92,409 | 93,963 |
| 2022 | 88,078 | 80,499 | 93,384 | 73,598 | 86,447 | 91,784 | 96,204 | 95,665 | 95,346 | 97,787 | 91,372 | 82,025 |
| 2023 | 88,378 | 85,414 | 94,820 | 93,841 | 98,161 | 97,539 | 102,466 | 103,384 | 103,757 | 106,147 | 104,342 | 109,650 |
| 2024 | 93,142 | 97,866 | 105,193 | 104,268 | 108,852 | 104,717 | 107,365 | 109,338 | 106,976 | 106,397 | 104,355 | 104,900 |
| 2025 | 103,619 | 91,791 | 106,881 | 104,586 | 105,339 | 104,725 | 110,753 | 110,512 | 107,846 | 110,718 | 106,225 | 103,333 |
| 2026 | 103,124 | 95,487 | 108,875 | 105,972 | ||||||||
| - = No Data Reported; -- = Not Applicable; NA = Not Available; W = Withheld to avoid disclosure of individual company data. |
| Release Date: 6/30/2026 |
| Next Release Date: 7/31/2026 |