|
Download Data (XLS File) |
|
||||||||
|
||||||||
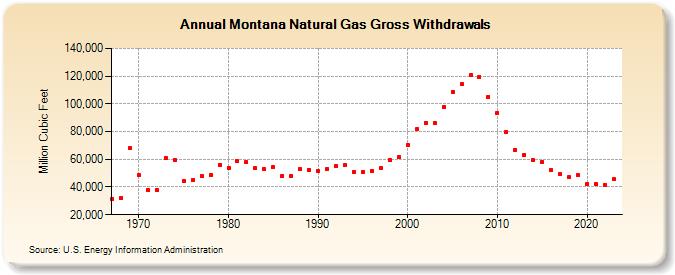
| Montana Natural Gas Gross Withdrawals (Million Cubic Feet) | ||||||||
| Decade | Year-0 | Year-1 | Year-2 | Year-3 | Year-4 | Year-5 | Year-6 | Year-7 | Year-8 | Year-9 |
|---|---|---|---|---|---|---|---|---|---|---|
| 1960's | 31,610 | 32,229 | 68,064 | |||||||
| 1970's | 48,302 | 38,136 | 38,137 | 60,931 | 59,524 | 44,547 | 45,097 | 48,181 | 48,497 | 56,094 |
| 1980's | 53,802 | 58,502 | 58,184 | 53,516 | 52,930 | 54,151 | 48,246 | 47,845 | 53,014 | 52,583 |
| 1990's | 51,537 | 53,002 | 54,810 | 55,517 | 51,072 | 50,763 | 51,668 | 53,621 | 59,506 | 61,545 |
| 2000's | 70,424 | 81,802 | 86,424 | 86,431 | 97,838 | 108,555 | 114,037 | 120,575 | 119,399 | 105,251 |
| 2010's | 93,266 | 79,506 | 66,954 | 63,242 | 59,160 | 58,240 | 52,146 | 49,437 | 47,074 | 48,616 |
| 2020's | 42,067 | 41,849 | 42,902 | 45,512 | 47,602 | 50,485 |
| - = No Data Reported; -- = Not Applicable; NA = Not Available; W = Withheld to avoid disclosure of individual company data. |
| Release Date: 6/30/2026 |
| Next Release Date: 7/31/2026 |