|
Download Data (XLS File) |
|
||||||||
|
||||||||
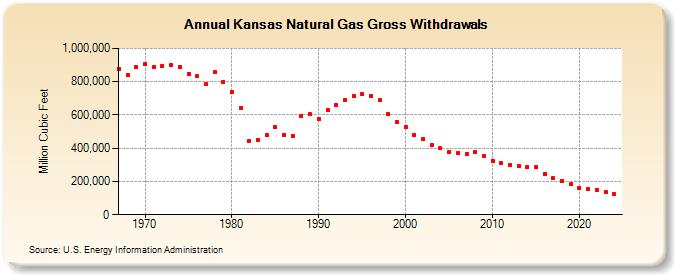
| Kansas Natural Gas Gross Withdrawals (Million Cubic Feet) | ||||||||
| Decade | Year-0 | Year-1 | Year-2 | Year-3 | Year-4 | Year-5 | Year-6 | Year-7 | Year-8 | Year-9 |
|---|---|---|---|---|---|---|---|---|---|---|
| 1960's | 876,353 | 839,773 | 887,603 | |||||||
| 1970's | 904,475 | 889,592 | 893,736 | 897,289 | 889,450 | 846,164 | 831,664 | 783,637 | 857,071 | 800,163 |
| 1980's | 737,246 | 641,833 | 442,243 | 448,515 | 481,614 | 529,575 | 480,166 | 474,127 | 594,386 | 602,722 |
| 1990's | 575,090 | 630,185 | 659,741 | 688,157 | 714,659 | 723,389 | 715,631 | 689,053 | 605,220 | 554,918 |
| 2000's | 527,151 | 481,445 | 456,132 | 420,027 | 398,197 | 378,250 | 372,029 | 366,859 | 375,314 | 355,394 |
| 2010's | 325,591 | 309,952 | 296,299 | 292,467 | 286,480 | 284,184 | 244,795 | 219,639 | 201,391 | 183,087 |
| 2020's | 163,362 | 152,986 | 147,950 | 136,897 | 125,943 | 122,273 |
| - = No Data Reported; -- = Not Applicable; NA = Not Available; W = Withheld to avoid disclosure of individual company data. |
| Release Date: 6/30/2026 |
| Next Release Date: 7/31/2026 |