|
Download Data (XLS File) |
|
||||||||
|
||||||||
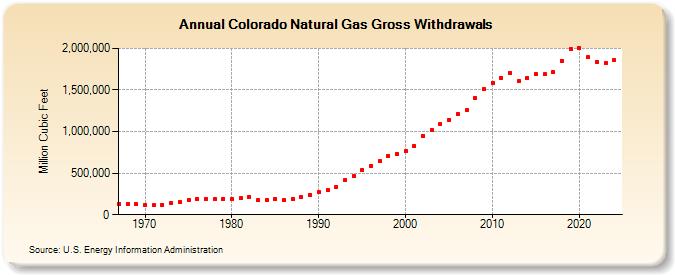
| Colorado Natural Gas Gross Withdrawals (Million Cubic Feet) | ||||||||
| Decade | Year-0 | Year-1 | Year-2 | Year-3 | Year-4 | Year-5 | Year-6 | Year-7 | Year-8 | Year-9 |
|---|---|---|---|---|---|---|---|---|---|---|
| 1960's | 128,014 | 129,583 | 123,337 | |||||||
| 1970's | 115,157 | 113,340 | 122,122 | 141,442 | 147,852 | 174,145 | 186,028 | 190,647 | 185,019 | 192,694 |
| 1980's | 191,806 | 200,739 | 214,933 | 172,842 | 180,616 | 189,565 | 175,618 | 186,286 | 212,030 | 237,372 |
| 1990's | 268,683 | 295,118 | 333,994 | 414,004 | 467,031 | 539,633 | 584,016 | 646,725 | 704,809 | 729,937 |
| 2000's | 760,213 | 825,378 | 945,659 | 1,021,294 | 1,089,622 | 1,143,985 | 1,214,396 | 1,254,529 | 1,402,845 | 1,511,654 |
| 2010's | 1,589,664 | 1,649,306 | 1,709,376 | 1,604,860 | 1,643,487 | 1,688,733 | 1,688,375 | 1,710,643 | 1,853,423 | 1,991,195 |
| 2020's | 1,999,784 | 1,891,913 | 1,833,421 | 1,826,767 | 1,846,820 | 1,869,840 |
| - = No Data Reported; -- = Not Applicable; NA = Not Available; W = Withheld to avoid disclosure of individual company data. |
| Release Date: 6/30/2026 |
| Next Release Date: 7/31/2026 |