|
Download Data (XLS File) |
|
||||||||
|
||||||||
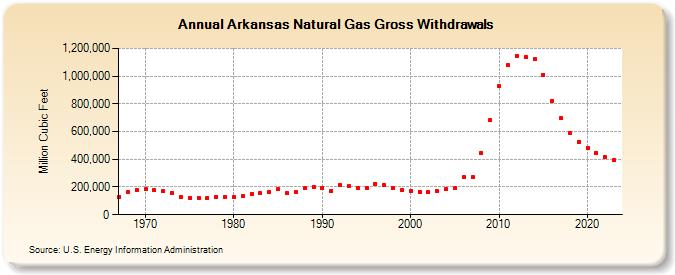
| Arkansas Natural Gas Gross Withdrawals (Million Cubic Feet) | ||||||||
| Decade | Year-0 | Year-1 | Year-2 | Year-3 | Year-4 | Year-5 | Year-6 | Year-7 | Year-8 | Year-9 |
|---|---|---|---|---|---|---|---|---|---|---|
| 1960's | 127,529 | 162,155 | 175,335 | |||||||
| 1970's | 183,650 | 174,883 | 169,171 | 159,476 | 125,691 | 121,518 | 121,147 | 122,756 | 127,954 | 127,469 |
| 1980's | 127,696 | 132,529 | 149,862 | 153,911 | 162,744 | 181,959 | 153,165 | 166,998 | 190,678 | 199,105 |
| 1990's | 195,405 | 169,632 | 210,906 | 204,552 | 195,413 | 195,369 | 224,446 | 210,787 | 189,709 | 177,160 |
| 2000's | 171,857 | 167,235 | 162,122 | 169,953 | 187,310 | 190,774 | 270,744 | 270,414 | 447,082 | 680,613 |
| 2010's | 927,479 | 1,076,757 | 1,146,168 | 1,139,654 | 1,122,733 | 1,010,382 | 823,196 | 694,676 | 589,985 | 524,757 |
| 2020's | 481,205 | 448,283 | 416,225 | 389,529 | 355,308 | 323,323 |
| - = No Data Reported; -- = Not Applicable; NA = Not Available; W = Withheld to avoid disclosure of individual company data. |
| Release Date: 6/30/2026 |
| Next Release Date: 7/31/2026 |