|
Download Data (XLS File) |
|
||||||||
|
||||||||
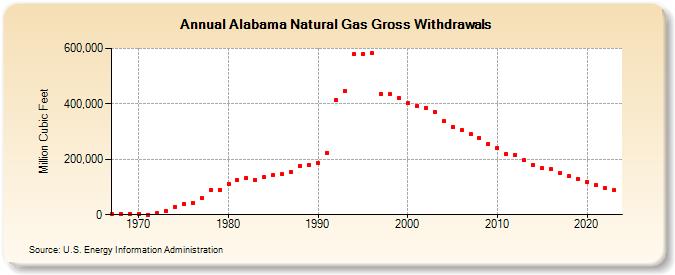
| Alabama Natural Gas Gross Withdrawals (Million Cubic Feet) | ||||||||
| Decade | Year-0 | Year-1 | Year-2 | Year-3 | Year-4 | Year-5 | Year-6 | Year-7 | Year-8 | Year-9 |
|---|---|---|---|---|---|---|---|---|---|---|
| 1960's | 2,200 | 1,802 | 2,585 | |||||||
| 1970's | 2,987 | 663 | 4,610 | 13,161 | 29,357 | 38,921 | 43,600 | 61,267 | 90,012 | 90,695 |
| 1980's | 111,836 | 125,624 | 133,298 | 125,889 | 136,427 | 143,420 | 145,625 | 155,143 | 175,054 | 180,300 |
| 1990's | 186,542 | 223,876 | 413,614 | 446,321 | 578,863 | 580,125 | 582,301 | 435,088 | 434,470 | 420,535 |
| 2000's | 401,336 | 391,981 | 386,502 | 370,910 | 338,735 | 317,206 | 306,144 | 289,618 | 277,553 | 255,965 |
| 2010's | 240,703 | 218,574 | 215,710 | 196,326 | 181,060 | 168,246 | 164,815 | 150,038 | 139,477 | 130,069 |
| 2020's | 117,030 | 107,233 | 95,795 | 87,391 | 75,800 |
| - = No Data Reported; -- = Not Applicable; NA = Not Available; W = Withheld to avoid disclosure of individual company data. |
| Release Date: 6/30/2026 |
| Next Release Date: 7/31/2026 |