|
Download Data (XLS File) |
|
||||||||
|
||||||||
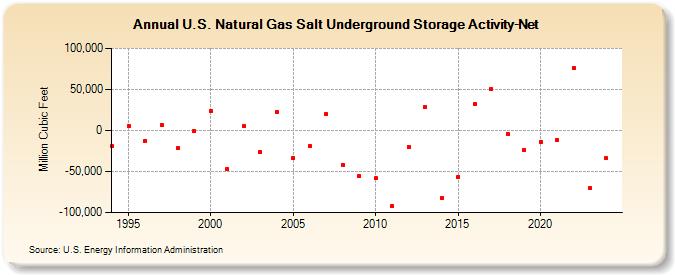
| U.S. Natural Gas Salt Underground Storage Activity-Net (Million Cubic Feet) | ||||||||
| Decade | Year-0 | Year-1 | Year-2 | Year-3 | Year-4 | Year-5 | Year-6 | Year-7 | Year-8 | Year-9 |
|---|---|---|---|---|---|---|---|---|---|---|
| 1990's | -19,376 | 5,419 | -12,622 | 6,367 | -21,639 | -569 | ||||
| 2000's | 24,200 | -47,490 | 4,864 | -25,973 | 22,970 | -33,755 | -18,935 | 20,001 | -42,044 | -56,010 |
| 2010's | -58,295 | -92,413 | -19,528 | 28,713 | -81,890 | -56,282 | 31,727 | 50,373 | -3,729 | -23,613 |
| 2020's | -13,947 | -11,884 | 76,369 | -69,541 | -33,868 | 13,979 |
| - = No Data Reported; -- = Not Applicable; NA = Not Available; W = Withheld to avoid disclosure of individual company data. |
| Release Date: 6/30/2026 |
| Next Release Date: 7/31/2026 |
Referring Pages: