|
Download Data (XLS File) |
|
||||||||
|
||||||||
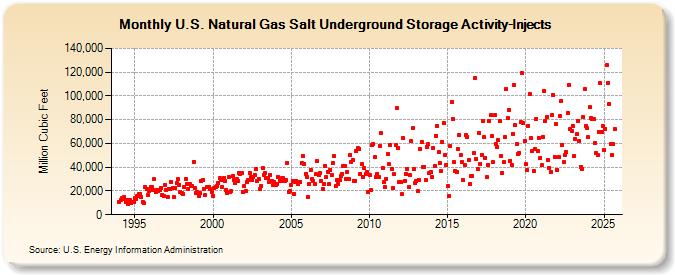
| U.S. Natural Gas Salt Underground Storage Activity-Injects (Million Cubic Feet) | ||||||||
| Year | Jan | Feb | Mar | Apr | May | Jun | Jul | Aug | Sep | Oct | Nov | Dec |
|---|---|---|---|---|---|---|---|---|---|---|---|---|
| 1994 | 10,956 | 12,444 | 13,738 | 13,524 | 14,931 | 10,472 | 12,153 | 9,236 | 12,757 | 10,248 | 10,991 | 10,792 |
| 1995 | 13,745 | 13,232 | 15,992 | 17,283 | 17,654 | 14,528 | 10,998 | 9,778 | 23,267 | 21,484 | 16,206 | 20,016 |
| 1996 | 23,488 | 23,256 | 21,012 | 29,831 | 18,909 | 20,523 | 20,268 | 20,540 | 22,624 | 16,908 | 15,716 | 25,394 |
| 1997 | 20,945 | 14,876 | 21,608 | 21,581 | 27,492 | 22,410 | 15,072 | 22,801 | 26,605 | 29,839 | 25,383 | 18,699 |
| 1998 | 18,091 | 17,783 | 23,444 | 30,168 | 25,873 | 21,482 | 26,158 | 24,084 | 24,200 | 44,723 | 22,501 | 18,461 |
| 1999 | 19,390 | 16,158 | 17,906 | 28,378 | 29,410 | 22,024 | 16,494 | 23,088 | 23,680 | 23,005 | 21,254 | 18,866 |
| 2000 | 15,558 | 22,648 | 23,516 | 24,379 | 27,001 | 30,582 | 29,501 | 23,710 | 30,559 | 28,773 | 21,222 | 18,466 |
| 2001 | 31,962 | 19,393 | 19,954 | 32,414 | 29,567 | 26,291 | 29,743 | 28,561 | 34,944 | 34,557 | 34,863 | 18,834 |
| 2002 | 23,968 | 19,690 | 27,454 | 28,885 | 35,126 | 31,504 | 29,015 | 32,007 | 33,713 | 38,133 | 28,565 | 30,339 |
| 2003 | 21,470 | 24,580 | 39,034 | 33,528 | 34,923 | 31,102 | 30,627 | 27,464 | 33,543 | 28,435 | 24,660 | 27,597 |
| 2004 | 24,945 | 25,566 | 31,735 | 28,671 | 28,292 | 30,751 | 30,495 | 28,238 | 28,876 | 43,552 | 19,413 | 20,005 |
| 2005 | 25,420 | 28,429 | 17,753 | 27,704 | 28,389 | 26,023 | 27,292 | 27,453 | 43,471 | 49,011 | 43,078 | 34,462 |
| 2006 | 31,538 | 15,219 | 26,245 | 37,499 | 30,246 | 28,460 | 25,701 | 33,881 | 44,857 | 33,451 | 34,889 | 28,770 |
| 2007 | 22,005 | 25,662 | 41,356 | 31,940 | 36,089 | 25,547 | 37,825 | 33,545 | 43,682 | 49,314 | 24,145 | 29,134 |
| 2008 | 26,257 | 28,889 | 32,413 | 34,333 | 40,601 | 40,828 | 30,024 | 36,092 | 30,450 | 50,003 | 44,697 | 45,676 |
| 2009 | 28,416 | 28,507 | 53,424 | 56,025 | 55,629 | 34,239 | 42,444 | 31,776 | 39,243 | 34,551 | 35,770 | 19,307 |
| 2010 | 33,362 | 20,933 | 58,383 | 59,799 | 48,161 | 31,338 | 34,062 | 31,711 | 57,772 | 68,520 | 39,270 | 27,380 |
| 2011 | 23,461 | 30,463 | 50,766 | 42,290 | 58,787 | 38,605 | 22,648 | 33,957 | 58,312 | 89,602 | 56,399 | 27,603 |
| 2012 | 27,434 | 17,161 | 64,421 | 28,445 | 34,211 | 38,170 | 23,007 | 33,202 | 61,691 | 72,686 | 38,141 | 26,436 |
| 2013 | 28,448 | 19,609 | 29,334 | 55,404 | 61,620 | 40,117 | 40,381 | 29,157 | 57,379 | 59,399 | 35,178 | 36,118 |
| 2014 | 31,667 | 56,036 | 40,874 | 66,677 | 75,046 | 52,485 | 43,331 | 37,088 | 60,911 | 77,492 | 50,276 | 42,161 |
| 2015 | 23,954 | 15,372 | 57,601 | 94,701 | 80,749 | 44,241 | 36,878 | 36,339 | 55,298 | 67,013 | 50,110 | 44,218 |
| 2016 | 28,935 | 42,199 | 66,733 | 65,726 | 45,659 | 25,901 | 32,413 | 32,763 | 51,595 | 115,243 | 47,282 | 38,290 |
| 2017 | 68,639 | 43,098 | 50,577 | 79,194 | 65,482 | 47,866 | 31,504 | 42,232 | 79,168 | 83,615 | 65,905 | 44,032 |
| 2018 | 83,686 | 59,500 | 57,317 | 62,504 | 78,686 | 49,373 | 35,086 | 44,506 | 65,331 | 105,866 | 81,434 | 88,134 |
| 2019 | 45,425 | 42,191 | 68,172 | 109,372 | 75,437 | 59,608 | 51,356 | 51,737 | 77,653 | 119,022 | 77,208 | 61,684 |
| 2020 | 42,440 | 37,532 | 75,093 | 101,917 | 64,504 | 53,920 | 37,004 | 54,911 | 80,966 | 53,721 | 64,692 | 47,921 |
| 2021 | 41,784 | 65,674 | 104,004 | 79,167 | 82,355 | 46,169 | 39,663 | 35,621 | 83,884 | 100,933 | 48,856 | 75,937 |
| 2022 | 37,516 | 48,216 | 83,193 | 95,492 | 58,325 | 44,111 | 49,862 | 52,440 | 85,785 | 108,904 | 71,740 | 70,675 |
| 2023 | 74,941 | 49,185 | 64,026 | 67,786 | 79,102 | 62,188 | 40,515 | 39,335 | 83,325 | 105,636 | 74,916 | 72,589 |
| 2024 | 65,188 | 90,370 | 81,381 | 80,908 | 80,440 | 60,179 | 51,910 | 50,202 | 70,012 | 110,859 | 69,650 | 74,518 |
| 2025 | 54,336 | 72,246 | 125,845 | 110,881 | 93,192 | 59,494 | 50,606 | 59,606 | 72,499 | 101,161 | 81,086 | 77,083 |
| 2026 | 54,633 | 70,523 | 105,868 | 97,270 | ||||||||
| - = No Data Reported; -- = Not Applicable; NA = Not Available; W = Withheld to avoid disclosure of individual company data. |
| Release Date: 6/30/2026 |
| Next Release Date: 7/31/2026 |
Referring Pages: