|
Download Data (XLS File) |
|
||||||||
|
||||||||
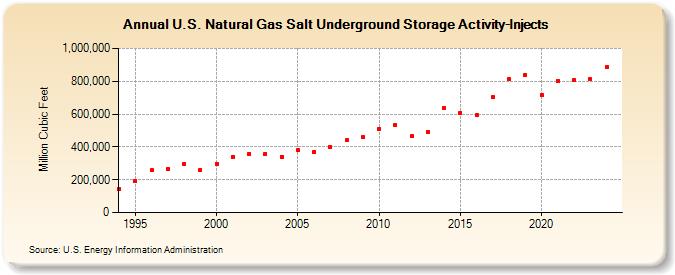
| U.S. Natural Gas Salt Underground Storage Activity-Injects (Million Cubic Feet) | ||||||||
| Decade | Year-0 | Year-1 | Year-2 | Year-3 | Year-4 | Year-5 | Year-6 | Year-7 | Year-8 | Year-9 |
|---|---|---|---|---|---|---|---|---|---|---|
| 1990's | 142,243 | 194,185 | 258,468 | 267,309 | 296,968 | 259,652 | ||||
| 2000's | 295,916 | 341,084 | 358,397 | 356,964 | 340,537 | 378,485 | 370,756 | 400,244 | 440,262 | 459,330 |
| 2010's | 510,691 | 532,893 | 465,005 | 492,143 | 634,045 | 606,473 | 592,740 | 701,312 | 811,423 | 838,865 |
| 2020's | 714,622 | 804,046 | 806,259 | 813,543 | 885,617 | 958,035 |
| - = No Data Reported; -- = Not Applicable; NA = Not Available; W = Withheld to avoid disclosure of individual company data. |
| Release Date: 6/30/2026 |
| Next Release Date: 7/31/2026 |
Referring Pages: