|
Download Data (XLS File) |
|
|||||
|
|||||
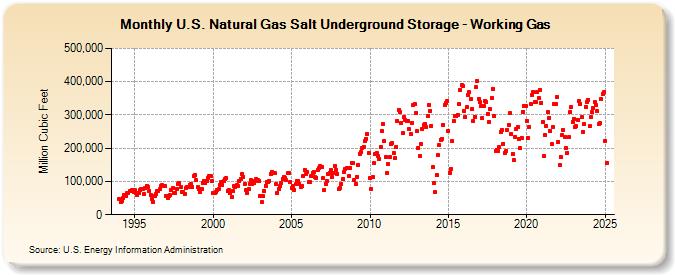
| U.S. Natural Gas Salt Underground Storage - Working Gas (Million Cubic Feet) | |||||
| Year | Jan | Feb | Mar | Apr | May | Jun | Jul | Aug | Sep | Oct | Nov | Dec |
|---|---|---|---|---|---|---|---|---|---|---|---|---|
| 1994 | 47,455 | 36,864 | 41,979 | 49,646 | 58,678 | 56,813 | 63,882 | 64,460 | 70,583 | 72,447 | 73,277 | 69,641 |
| 1995 | 72,965 | 64,476 | 58,510 | 66,025 | 73,529 | 78,437 | 76,026 | 63,026 | 80,949 | 87,711 | 83,704 | 71,638 |
| 1996 | 58,880 | 47,581 | 37,918 | 56,995 | 62,439 | 71,476 | 70,906 | 75,927 | 84,962 | 88,061 | 87,029 | 85,140 |
| 1997 | 57,054 | 49,490 | 55,865 | 58,039 | 73,265 | 79,811 | 65,589 | 66,536 | 77,598 | 93,020 | 95,180 | 82,610 |
| 1998 | 69,390 | 68,851 | 63,549 | 80,476 | 82,711 | 83,080 | 90,544 | 92,319 | 83,365 | 115,709 | 118,521 | 104,104 |
| 1999 | 82,043 | 77,133 | 67,758 | 77,908 | 94,436 | 101,788 | 95,521 | 102,210 | 111,680 | 115,048 | 116,495 | 99,921 |
| 2000 | 64,686 | 65,513 | 68,762 | 73,606 | 77,383 | 90,189 | 97,110 | 89,625 | 100,844 | 107,493 | 110,471 | 71,905 |
| 2001 | 73,430 | 66,772 | 53,088 | 70,924 | 85,107 | 84,689 | 88,705 | 85,959 | 100,321 | 108,318 | 123,340 | 114,611 |
| 2002 | 92,677 | 74,034 | 64,952 | 76,701 | 93,328 | 103,526 | 91,112 | 95,656 | 102,493 | 108,402 | 105,757 | 102,085 |
| 2003 | 56,375 | 37,527 | 57,340 | 71,998 | 87,088 | 97,650 | 98,424 | 102,160 | 123,017 | 129,417 | 124,825 | 124,988 |
| 2004 | 92,335 | 66,733 | 77,524 | 85,881 | 94,646 | 107,676 | 114,858 | 110,912 | 103,082 | 124,414 | 126,755 | 98,268 |
| 2005 | 80,142 | 87,269 | 75,497 | 91,043 | 100,018 | 100,865 | 91,937 | 83,303 | 86,596 | 115,230 | 134,822 | 122,827 |
| 2006 | 128,836 | 97,781 | 97,539 | 115,592 | 126,108 | 127,828 | 113,612 | 111,338 | 135,837 | 140,349 | 146,459 | 144,291 |
| 2007 | 109,286 | 74,136 | 93,355 | 101,900 | 123,430 | 125,656 | 133,372 | 112,984 | 125,135 | 147,002 | 135,311 | 123,204 |
| 2008 | 76,156 | 81,773 | 92,536 | 107,146 | 127,487 | 138,463 | 140,451 | 138,983 | 116,011 | 140,963 | 156,854 | 154,332 |
| 2009 | 104,572 | 93,719 | 114,268 | 148,853 | 182,639 | 187,219 | 200,469 | 203,991 | 221,991 | 228,689 | 243,351 | 185,769 |
| 2010 | 109,460 | 76,953 | 112,185 | 154,702 | 183,331 | 186,132 | 176,996 | 167,511 | 204,722 | 251,719 | 271,964 | 220,417 |
| 2011 | 174,414 | 125,066 | 151,198 | 172,023 | 211,140 | 214,240 | 185,990 | 169,061 | 203,835 | 281,390 | 315,569 | 309,026 |
| 2012 | 276,759 | 244,172 | 292,533 | 285,236 | 282,422 | 281,588 | 256,624 | 241,799 | 276,900 | 329,201 | 332,418 | 306,441 |
| 2013 | 251,545 | 200,250 | 175,681 | 213,394 | 257,613 | 269,357 | 273,112 | 263,930 | 296,343 | 330,570 | 312,560 | 267,730 |
| 2014 | 142,726 | 94,832 | 68,247 | 119,358 | 178,935 | 208,878 | 226,099 | 229,093 | 270,893 | 330,904 | 335,283 | 340,855 |
| 2015 | 252,270 | 126,686 | 138,401 | 220,660 | 283,136 | 297,487 | 296,996 | 301,018 | 332,729 | 375,893 | 389,384 | 387,099 |
| 2016 | 312,055 | 294,962 | 322,486 | 358,453 | 367,583 | 348,408 | 318,719 | 281,303 | 294,992 | 383,088 | 402,434 | 348,523 |
| 2017 | 337,845 | 327,528 | 291,861 | 326,058 | 342,541 | 339,164 | 303,810 | 278,944 | 317,579 | 350,437 | 378,777 | 296,514 |
| 2018 | 192,120 | 195,679 | 192,209 | 202,357 | 248,679 | 255,073 | 213,511 | 186,962 | 190,049 | 254,223 | 270,200 | 304,553 |
| 2019 | 243,094 | 182,671 | 164,341 | 234,220 | 258,101 | 262,217 | 226,948 | 200,269 | 232,102 | 309,664 | 327,914 | 326,922 |
| 2020 | 282,916 | 231,162 | 262,959 | 333,392 | 359,241 | 367,673 | 339,240 | 338,655 | 369,971 | 351,043 | 375,929 | 336,817 |
| 2021 | 278,584 | 176,321 | 241,066 | 267,102 | 308,280 | 291,516 | 251,745 | 211,993 | 265,177 | 334,074 | 333,084 | 354,333 |
| 2022 | 219,905 | 149,764 | 174,923 | 239,208 | 254,454 | 233,844 | 199,910 | 186,820 | 232,359 | 307,735 | 322,475 | 279,640 |
| 2023 | 288,570 | 262,917 | 265,506 | 285,722 | 322,479 | 332,882 | 292,303 | 249,617 | 272,594 | 325,163 | 338,773 | 345,155 |
| 2024 | 265,193 | 293,300 | 308,026 | 320,242 | 337,870 | 329,677 | 310,311 | 271,695 | 274,475 | 346,685 | 363,755 | 368,353 |
| 2025 | 222,710 | 155,269 | 230,654 | 294,814 | 345,688 | 340,743 | 299,611 | 278,201 | 293,576 | 346,568 | 382,098 | 350,462 |
| 2026 | 214,982 | 178,931 | 231,979 | 276,831 | ||||||||
| - = No Data Reported; -- = Not Applicable; NA = Not Available; W = Withheld to avoid disclosure of individual company data. |
| Release Date: 6/30/2026 |
| Next Release Date: 7/31/2026 |
Referring Pages: