|
Download Data (XLS File) |
|
||||||||
|
||||||||
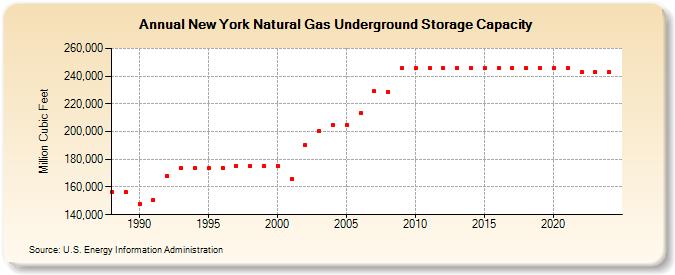
| New York Natural Gas Underground Storage Capacity (Million Cubic Feet) | ||||||||
| Decade | Year-0 | Year-1 | Year-2 | Year-3 | Year-4 | Year-5 | Year-6 | Year-7 | Year-8 | Year-9 |
|---|---|---|---|---|---|---|---|---|---|---|
| 1980's | 156,259 | 156,259 | ||||||||
| 1990's | 147,618 | 150,538 | 167,834 | 173,463 | 173,463 | 173,463 | 173,979 | 175,479 | 175,479 | 175,129 |
| 2000's | 175,495 | 166,000 | 190,156 | 200,545 | 204,765 | 204,855 | 213,225 | 229,013 | 228,613 | 245,579 |
| 2010's | 245,579 | 245,579 | 245,579 | 245,779 | 245,779 | 245,779 | 245,779 | 245,779 | 245,779 | 245,779 |
| 2020's | 245,779 | 245,779 | 242,791 | 242,791 | 242,791 |
| - = No Data Reported; -- = Not Applicable; NA = Not Available; W = Withheld to avoid disclosure of individual company data. |
| Release Date: 6/30/2026 |
| Next Release Date: 7/31/2026 |