|
Download Data (XLS File) |
|
||||||||
|
||||||||
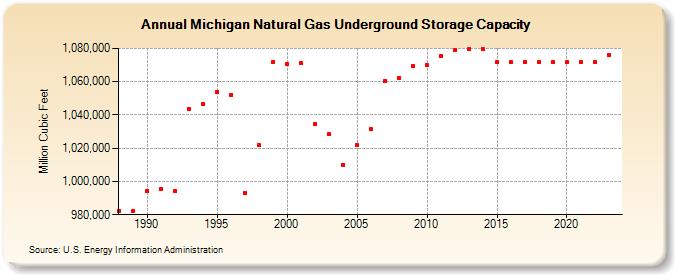
| Michigan Natural Gas Underground Storage Capacity (Million Cubic Feet) | ||||||||
| Decade | Year-0 | Year-1 | Year-2 | Year-3 | Year-4 | Year-5 | Year-6 | Year-7 | Year-8 | Year-9 |
|---|---|---|---|---|---|---|---|---|---|---|
| 1980's | 982,362 | 982,362 | ||||||||
| 1990's | 994,542 | 995,181 | 994,281 | 1,043,781 | 1,046,582 | 1,053,814 | 1,052,236 | 992,933 | 1,021,674 | 1,071,699 |
| 2000's | 1,070,716 | 1,071,000 | 1,034,429 | 1,028,344 | 1,010,034 | 1,021,622 | 1,031,290 | 1,060,558 | 1,062,339 | 1,069,405 |
| 2010's | 1,069,898 | 1,075,472 | 1,078,979 | 1,079,424 | 1,079,462 | 1,071,630 | 1,071,630 | 1,071,608 | 1,071,608 | 1,071,608 |
| 2020's | 1,071,608 | 1,071,608 | 1,071,580 | 1,076,066 | 1,076,066 |
| - = No Data Reported; -- = Not Applicable; NA = Not Available; W = Withheld to avoid disclosure of individual company data. |
| Release Date: 6/30/2026 |
| Next Release Date: 7/31/2026 |