|
Download Data (XLS File) |
|
||||||||
|
||||||||
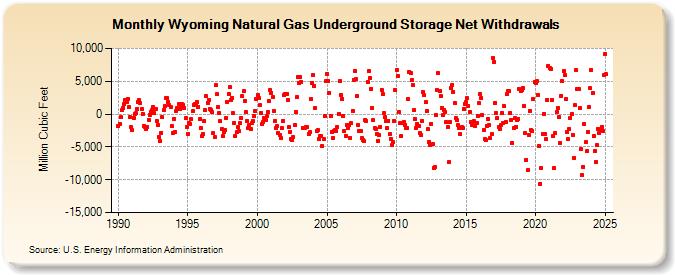
| Wyoming Natural Gas Underground Storage Net Withdrawals (Million Cubic Feet) | ||||||||
| Year | Jan | Feb | Mar | Apr | May | Jun | Jul | Aug | Sep | Oct | Nov | Dec |
|---|---|---|---|---|---|---|---|---|---|---|---|---|
| 1990 | -1,823 | -1,539 | -501 | 557 | 957 | 1,504 | 2,101 | 1,874 | 2,341 | 1,041 | -520 | -2,030 |
| 1991 | -2,500 | -626 | 26 | 115 | 802 | 1,849 | 2,068 | 1,628 | 761 | 54 | -1,809 | -1,941 |
| 1992 | -2,269 | -2,005 | -866 | -84 | 343 | 568 | 1,069 | 101 | 814 | -1,034 | -1,735 | -3,440 |
| 1993 | -4,101 | -2,869 | -438 | 611 | 1,198 | 2,416 | 2,413 | 1,866 | 1,334 | 1,035 | -1,829 | -2,856 |
| 1994 | -695 | -2,756 | 496 | 875 | 1,568 | 752 | 1,113 | 1,499 | 1,434 | 963 | -659 | -2,007 |
| 1995 | -3,017 | -1,374 | -1,449 | -817 | 416 | 1,447 | 1,580 | 1,566 | 1,841 | 1,125 | -768 | -2,100 |
| 1996 | -3,410 | -3,044 | -1,095 | 644 | 2,704 | 1,760 | 2,160 | 771 | 613 | 272 | -2,903 | -3,529 |
| 1997 | 4,376 | 2,995 | 1,090 | 137 | -1,127 | -2,304 | -3,411 | -2,727 | -2,454 | -591 | 1,906 | 3,019 |
| 1998 | 4,069 | 2,092 | 2,499 | 116 | -1,332 | -3,398 | -2,807 | -2,007 | -2,614 | -1,425 | -590 | 2,677 |
| 1999 | 3,448 | 2,037 | 348 | -997 | -2,133 | -1,662 | -2,294 | -1,371 | -1,030 | -307 | 539 | 2,359 |
| 2000 | 2,935 | 2,373 | 1,328 | 116 | -1,590 | -1,168 | -553 | -897 | -360 | 336 | 1,933 | 3,611 |
| 2001 | 3,224 | 2,587 | 525 | -1,080 | -2,070 | -1,812 | -2,899 | -3,169 | -3,717 | -2,112 | -1,031 | 2,853 |
| 2002 | 3,104 | 3,081 | 2,116 | -1,962 | -2,722 | -3,741 | -3,971 | -3,479 | -1,678 | 292 | 2,574 | 5,645 |
| 2003 | 4,741 | 5,576 | 4,899 | -2,118 | -2,151 | -2,139 | -1,955 | -2,016 | -3,016 | -2,733 | 2,279 | 4,788 |
| 2004 | 5,898 | 4,270 | 995 | -2,598 | -2,484 | -3,774 | -3,382 | -3,402 | -4,845 | -3,767 | -221 | 5,066 |
| 2005 | 6,118 | 5,025 | 3,181 | -356 | -2,760 | -3,626 | -2,620 | -2,452 | -2,572 | -1,953 | 62 | 5,044 |
| 2006 | 2,891 | 2,335 | -330 | -2,638 | -3,283 | -1,635 | -2,195 | -1,608 | -3,589 | -1,434 | 538 | 5,242 |
| 2007 | 6,555 | 5,273 | 2,724 | -1,644 | -2,640 | -2,651 | -3,654 | -3,976 | -4,176 | -887 | -1,047 | 4,822 |
| 2008 | 6,543 | 5,521 | 3,858 | 857 | -951 | -2,125 | -2,291 | -2,996 | -4,038 | -3,216 | -1,944 | 3,735 |
| 2009 | 3,024 | 164 | -487 | -994 | -2,089 | -981 | -3,062 | -3,770 | -4,762 | -4,308 | -1,086 | 3,606 |
| 2010 | 6,680 | 5,778 | 322 | -1,355 | -3,385 | -1,385 | -1,177 | -1,671 | -2,105 | -2,102 | 2,243 | 6,451 |
| 2011 | 6,220 | 5,208 | 4,422 | 597 | -737 | -2,070 | -1,494 | -1,854 | -2,825 | -3,127 | -997 | 3,292 |
| 2012 | 2,839 | 1,769 | 433 | -2,349 | -4,203 | -4,782 | -1,496 | -4,531 | -8,202 | -8,051 | -105 | 3,662 |
| 2013 | 6,183 | 3,478 | 2,774 | 997 | -123 | 588 | 318 | -1,213 | -1,979 | -7,314 | -1,164 | 3,970 |
| 2014 | 4,440 | 3,435 | 1,635 | -575 | -953 | -1,709 | -2,118 | -3,075 | -2,016 | -2,049 | 831 | 1,586 |
| 2015 | 1,901 | 2,397 | 1,217 | 308 | -1,151 | -1,715 | -1,186 | -1,115 | -1,866 | -1,419 | -255 | 1,646 |
| 2016 | 3,031 | 2,448 | -139 | -2,386 | -3,858 | -3,980 | -1,773 | -769 | -1,656 | -3,717 | -3,105 | 8,555 |
| 2017 | 8,000 | 1,737 | 234 | -632 | -1,936 | -2,290 | -1,694 | 172 | -1,390 | 1,188 | -1,194 | 3,028 |
| 2018 | 3,503 | 3,444 | 136 | -936 | -4,390 | -2,156 | -612 | -1,932 | -841 | -702 | 3,845 | 3,553 |
| 2019 | 3,680 | 3,903 | 1,199 | -2,941 | -6,945 | -8,583 | -3,169 | 459 | -2,433 | -2,593 | 2,305 | 4,901 |
| 2020 | 4,776 | 4,961 | 2,955 | -4,839 | -10,598 | -8,224 | -3,048 | 78 | -3,015 | -3,846 | 2,177 | 7,281 |
| 2021 | 6,957 | 6,918 | 2,182 | -3,300 | -8,193 | -2,938 | 287 | 907 | -514 | -4,384 | 2,824 | 5,036 |
| 2022 | 6,503 | 5,921 | 2,279 | -2,750 | -3,846 | -2,233 | -562 | -63 | -3,191 | -6,646 | 1,339 | 6,658 |
| 2023 | 3,873 | 3,795 | 894 | -5,341 | -9,227 | -8,004 | -1,529 | -4,331 | -5,697 | -2,783 | 1,118 | 3,895 |
| 2024 | 6,756 | 3,229 | -3,304 | -5,629 | -7,291 | -4,780 | -2,230 | -2,836 | -2,373 | -1,900 | -2,606 | 5,981 |
| 2025 | 9,205 | 6,042 | -1,024 | -5,692 | -8,482 | -6,603 | -2,410 | 755 | -1,179 | -4,671 | 1,887 | 6,884 |
| 2026 | 8,764 | 3,558 | -4,147 | -3,912 | ||||||||
| - = No Data Reported; -- = Not Applicable; NA = Not Available; W = Withheld to avoid disclosure of individual company data. |
| Release Date: 6/30/2026 |
| Next Release Date: 7/31/2026 |