|
Download Data (XLS File) |
|
||||||||
|
||||||||
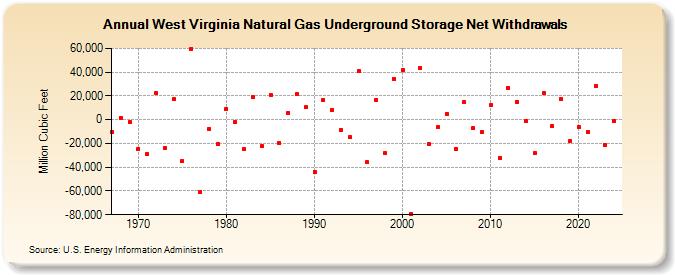
| West Virginia Natural Gas Underground Storage Net Withdrawals (Million Cubic Feet) | ||||||||
| Decade | Year-0 | Year-1 | Year-2 | Year-3 | Year-4 | Year-5 | Year-6 | Year-7 | Year-8 | Year-9 |
|---|---|---|---|---|---|---|---|---|---|---|
| 1960's | -10,515 | 1,644 | -1,972 | |||||||
| 1970's | -24,430 | -29,246 | 22,163 | -23,510 | 17,007 | -34,744 | 59,906 | -60,727 | -7,632 | -20,304 |
| 1980's | 9,031 | -2,035 | -25,050 | 18,845 | -21,959 | 20,818 | -19,522 | 5,914 | 21,591 | 10,375 |
| 1990's | -43,659 | 16,888 | 8,180 | -8,614 | -14,932 | 41,129 | -35,844 | 16,716 | -28,267 | 34,622 |
| 2000's | 42,171 | -79,233 | 43,298 | -20,815 | -6,359 | 4,918 | -24,423 | 14,540 | -7,249 | -10,174 |
| 2010's | 12,132 | -32,304 | 26,959 | 15,043 | -765 | -28,151 | 22,407 | -5,627 | 17,127 | -18,213 |
| 2020's | -5,911 | -10,516 | 28,196 | -21,349 | -963 | 23,600 |
| - = No Data Reported; -- = Not Applicable; NA = Not Available; W = Withheld to avoid disclosure of individual company data. |
| Release Date: 6/30/2026 |
| Next Release Date: 7/31/2026 |