|
Download Data (XLS File) |
|
||||||||
|
||||||||
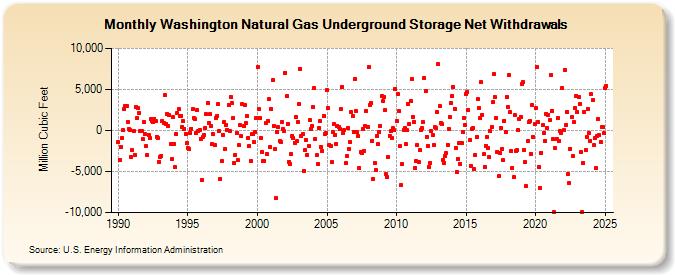
| Washington Natural Gas Underground Storage Net Withdrawals (Million Cubic Feet) | ||||||||
| Year | Jan | Feb | Mar | Apr | May | Jun | Jul | Aug | Sep | Oct | Nov | Dec |
|---|---|---|---|---|---|---|---|---|---|---|---|---|
| 1990 | -1,451 | -3,625 | -1,954 | -938 | 0 | 2,640 | 2,937 | 2,937 | 1,069 | 205 | 81 | -3,227 |
| 1991 | -2,437 | -103 | -2,944 | 2,833 | 1,522 | 2,716 | 2,138 | -60 | -5 | -1,040 | 1,040 | -458 |
| 1992 | -1,930 | -2,979 | -581 | -877 | 1,351 | 1,175 | 1,024 | 1,458 | 1,196 | -760 | -947 | -3,797 |
| 1993 | -3,203 | -3,122 | 1,181 | 956 | 4,292 | 825 | 2,036 | 597 | 1,881 | -1,639 | -3,528 | 1,639 |
| 1994 | -1,605 | -4,473 | -437 | 2,095 | 2,599 | 1,761 | 1,805 | 449 | 1,131 | 216 | -391 | -1,576 |
| 1995 | -2,097 | -2,230 | -253 | 233 | 2,570 | 1,551 | 1,413 | -271 | 2,494 | -100 | 67 | -1,015 |
| 1996 | -6,047 | -769 | -540 | 356 | 1,973 | 3,317 | 935 | 1,965 | 597 | -1,648 | -462 | -1,746 |
| 1997 | 1,566 | 1,784 | 3,200 | -71 | -5,881 | -3,766 | -495 | 982 | -2,268 | 702 | 83 | 3,159 |
| 1998 | -62 | 4,131 | 3,328 | 1,542 | -3,938 | -2,967 | -313 | -3,645 | -1,825 | 718 | -732 | 3,223 |
| 1999 | 514 | 3,064 | 934 | 1,763 | -875 | -1,875 | -3,748 | -477 | -477 | -1,462 | -152 | 1,577 |
| 2000 | 7,755 | 2,566 | 1,485 | -893 | -2,639 | -3,660 | -3,739 | 909 | -2,835 | 1,188 | 3,781 | -1,986 |
| 2001 | 2,608 | 6,110 | 592 | -2,300 | -8,283 | -200 | 372 | -1,343 | -1,450 | 1,030 | 145 | -102 |
| 2002 | 7,037 | 4,145 | 849 | -3,810 | -4,057 | -2,918 | -620 | -956 | -1,487 | 1,698 | -1,335 | 1,092 |
| 2003 | 3,221 | 7,520 | -624 | -412 | -4,927 | -2,415 | -1,140 | -2,957 | -1,935 | 1,266 | 167 | 499 |
| 2004 | 2,817 | 5,119 | -1,019 | -3,032 | -4,075 | 242 | 1,118 | -1,980 | -2,509 | 1,765 | -453 | -351 |
| 2005 | 4,887 | 2,681 | -1,742 | -1,895 | -3,901 | -233 | 848 | -547 | -1,643 | 520 | 387 | 153 |
| 2006 | 2,574 | 5,326 | -267 | 46 | -3,986 | -3,077 | 284 | -2,235 | -1,380 | 2,247 | 1,721 | -126 |
| 2007 | 6,329 | 2,370 | -197 | -710 | -4,563 | -2,648 | -2,746 | 223 | -2,451 | 557 | 2,357 | 418 |
| 2008 | 7,726 | 3,158 | 3,387 | -1,241 | -5,887 | -3,957 | -4,761 | -682 | -1,695 | -160 | 585 | 4,195 |
| 2009 | 3,587 | 4,106 | 2,494 | -5,343 | -5,639 | -3,202 | -641 | -105 | -971 | 261 | 23 | 5,071 |
| 2010 | 1,149 | 4,423 | 2,318 | -1,929 | -6,651 | -4,101 | 89 | 297 | -1,696 | 15 | 3,233 | 755 |
| 2011 | 3,591 | 6,283 | 1,701 | 1,048 | -4,525 | -3,692 | -1,791 | -3,895 | -2,437 | 91 | 248 | 1,016 |
| 2012 | 6,406 | 4,771 | -755 | -1,859 | -4,427 | -3,984 | -114 | -491 | -1,782 | 370 | 259 | 2,259 |
| 2013 | 8,097 | 2,959 | 881 | 843 | -3,543 | -3,923 | -3,122 | -2,784 | -1,731 | 197 | 1,662 | 3,376 |
| 2014 | 4,221 | 5,288 | 2,671 | -2,089 | -5,031 | -3,418 | -1,529 | -4,077 | -1,524 | -223 | 1,577 | 676 |
| 2015 | 4,416 | 4,712 | 2,520 | -1,199 | -4,285 | 122 | 278 | -4,747 | -2,976 | -792 | 3,788 | 2,710 |
| 2016 | 1,480 | 5,854 | 1,935 | -2,918 | -4,392 | -1,834 | -788 | -2,091 | -3,266 | -109 | 448 | 3,465 |
| 2017 | 6,908 | 4,022 | 1,556 | -2,596 | -5,577 | -2,739 | 329 | -2,225 | -3,610 | 1,203 | -191 | 4,053 |
| 2018 | 2,896 | 6,762 | 2,206 | -2,546 | -4,561 | -5,671 | 1,854 | -2,448 | -2,437 | 53 | 1,393 | 1,698 |
| 2019 | 5,673 | 5,868 | -2,335 | -3,896 | -6,802 | -1,299 | 975 | 1,168 | -2,826 | 3,069 | -812 | 758 |
| 2020 | 2,679 | 7,727 | 1,049 | -4,459 | -6,967 | -2,712 | 693 | -299 | -1,275 | 2,020 | 322 | 1,944 |
| 2021 | 1,286 | 6,790 | 2,431 | -1,095 | -9,912 | -2,195 | -980 | 1,533 | -1,284 | -121 | -332 | 5,156 |
| 2022 | 24 | 7,379 | 655 | 2,281 | -5,357 | -6,395 | -2,202 | 1,591 | -3,168 | 987 | 2,705 | 4,225 |
| 2023 | 2,266 | 4,095 | 3,248 | -2,677 | -9,928 | -3,940 | 2,303 | -2,408 | -767 | 2,668 | -312 | -1,229 |
| 2024 | 4,443 | 3,668 | -1,824 | -972 | -4,598 | -710 | 1,380 | -592 | -1,400 | 432 | 378 | -329 |
| 2025 | 5,191 | 5,449 | -1,450 | -3,669 | -1,869 | -2,282 | -965 | 478 | -1,571 | 991 | -568 | 1,361 |
| 2026 | 4,050 | 3,206 | 1,225 | -1,324 | ||||||||
| - = No Data Reported; -- = Not Applicable; NA = Not Available; W = Withheld to avoid disclosure of individual company data. |
| Release Date: 6/30/2026 |
| Next Release Date: 7/31/2026 |