|
Download Data (XLS File) |
|
||||||||
|
||||||||
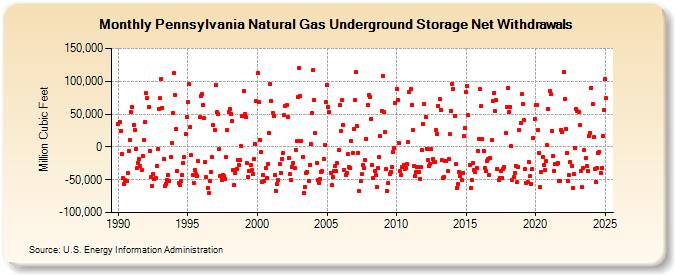
| Pennsylvania Natural Gas Underground Storage Net Withdrawals (Million Cubic Feet) | ||||||||
| Year | Jan | Feb | Mar | Apr | May | Jun | Jul | Aug | Sep | Oct | Nov | Dec |
|---|---|---|---|---|---|---|---|---|---|---|---|---|
| 1990 | 35,301 | 38,473 | 24,660 | -10,808 | -47,475 | -56,280 | -50,273 | -52,031 | -40,511 | -5,886 | 10,484 | 52,829 |
| 1991 | 60,339 | 34,060 | 25,981 | -2,751 | -32,592 | -24,209 | -19,127 | -29,625 | -34,526 | -13,835 | 10,030 | 37,591 |
| 1992 | 81,577 | 73,709 | 61,022 | -6,017 | -45,507 | -58,946 | -41,339 | -48,824 | -47,631 | -28,736 | -2,844 | 57,665 |
| 1993 | 74,051 | 104,040 | 58,930 | -18,524 | -60,221 | -56,391 | -50,022 | -43,202 | -51,998 | -15,361 | 6,445 | 51,602 |
| 1994 | 112,189 | 79,325 | 27,563 | -36,655 | -54,248 | -57,942 | -51,484 | -43,337 | -23,836 | -14,950 | 19,352 | 44,846 |
| 1995 | 68,842 | 96,191 | 29,726 | -12,857 | -43,325 | -54,283 | -35,648 | -41,423 | -44,608 | -22,123 | 45,269 | 78,025 |
| 1996 | 80,122 | 64,167 | 43,459 | -22,497 | -46,338 | -62,061 | -69,480 | -52,038 | -37,711 | -15,621 | 33,464 | 25,003 |
| 1997 | 94,422 | 52,423 | 50,395 | -3,188 | -43,897 | -50,051 | -42,074 | -44,878 | -48,745 | -15,914 | 26,061 | 53,825 |
| 1998 | 57,879 | 49,416 | 39,608 | -34,442 | -58,295 | -39,947 | -33,256 | -19,997 | -28,003 | -20,516 | 858 | 46,685 |
| 1999 | 84,818 | 49,624 | 45,462 | -24,531 | -46,154 | -36,043 | -27,893 | -35,101 | -41,496 | -19,029 | 4,253 | 69,287 |
| 2000 | 111,880 | 67,677 | 11,111 | -7,150 | -52,860 | -42,636 | -52,039 | -32,778 | -47,265 | -26,640 | 21,869 | 96,037 |
| 2001 | 69,700 | 51,332 | 47,115 | -43,294 | -67,098 | -55,953 | -51,167 | -25,643 | -39,316 | -18,104 | -9,610 | 48,276 |
| 2002 | 61,868 | 63,171 | 46,182 | -16,579 | -41,784 | -49,829 | -29,902 | -24,723 | -32,448 | -4,259 | 9,548 | 75,594 |
| 2003 | 119,756 | 77,495 | 8,917 | -15,724 | -69,939 | -61,273 | -40,141 | -37,941 | -51,931 | -27,035 | 3,943 | 51,569 |
| 2004 | 117,578 | 71,467 | 20,738 | -24,454 | -51,141 | -54,759 | -49,633 | -38,039 | -37,399 | -18,198 | 3,546 | 68,256 |
| 2005 | 94,532 | 60,530 | 52,490 | -39,072 | -58,779 | -45,118 | -36,375 | -28,433 | -37,059 | -24,792 | -4,101 | 63,473 |
| 2006 | 23,822 | 71,749 | 33,080 | -35,025 | -42,735 | -39,933 | -10,900 | -30,651 | -31,865 | 9,196 | -8,952 | 27,757 |
| 2007 | 70,867 | 113,682 | 31,665 | -8,592 | -67,254 | -52,033 | -41,672 | -27,476 | -31,983 | -20,546 | 12,735 | 63,091 |
| 2008 | 79,188 | 75,871 | 42,797 | -27,058 | -47,376 | -36,061 | -43,437 | -60,803 | -32,138 | -15,157 | 16,716 | 55,061 |
| 2009 | 108,180 | 52,415 | 22,567 | -33,377 | -67,098 | -55,151 | -41,644 | -37,849 | -30,396 | -7,541 | -1,803 | 66,347 |
| 2010 | 88,380 | 71,042 | 6,555 | -36,797 | -42,339 | -30,150 | -27,367 | -32,964 | -32,666 | -26,322 | 6,776 | 83,180 |
| 2011 | 88,151 | 63,132 | 25,916 | -29,031 | -43,599 | -38,437 | -30,302 | -38,365 | -48,928 | -30,692 | -4,979 | 34,768 |
| 2012 | 65,216 | 46,000 | -2,877 | -19,303 | -29,812 | -25,357 | -3,492 | -18,095 | -23,013 | -23,054 | 25,033 | 20,318 |
| 2013 | 62,836 | 72,481 | 56,823 | -20,577 | -47,455 | -45,724 | -21,295 | -21,520 | -37,313 | -19,186 | 19,198 | 55,121 |
| 2014 | 96,309 | 88,267 | 46,657 | -26,488 | -63,219 | -55,862 | -38,363 | -44,335 | -50,233 | -39,656 | 16,036 | 29,332 |
| 2015 | 83,807 | 92,652 | 48,329 | -27,319 | -62,659 | -51,105 | -24,593 | -35,179 | -38,785 | -31,589 | -6,135 | 11,466 |
| 2016 | 87,473 | 62,426 | 11,919 | -5,601 | -32,012 | -36,463 | -21,094 | -18,752 | -43,300 | -16,859 | 10,492 | 70,114 |
| 2017 | 82,560 | 54,306 | 70,898 | -33,170 | -51,111 | -46,732 | -37,135 | -47,206 | -33,239 | -31,295 | 20,680 | 61,182 |
| 2018 | 90,102 | 53,807 | 60,784 | 858 | -50,138 | -46,334 | -39,628 | -28,602 | -54,224 | -30,599 | 25,911 | 35,891 |
| 2019 | 80,114 | 65,257 | 41,514 | -33,670 | -55,605 | -53,396 | -22,994 | -44,933 | -56,268 | -34,039 | 13,862 | 42,184 |
| 2020 | 63,541 | 63,825 | 26,065 | -8,892 | -60,384 | -38,467 | -15,408 | -26,992 | -35,932 | -21,162 | 3,070 | 58,158 |
| 2021 | 84,848 | 79,990 | 23,890 | -14,355 | -36,245 | -25,942 | -25,674 | -24,543 | -52,092 | -51,616 | 26,347 | 22,447 |
| 2022 | 114,206 | 73,244 | 27,667 | -8,613 | -51,337 | -42,583 | -22,422 | -29,303 | -62,085 | -41,303 | -1,035 | 57,227 |
| 2023 | 55,330 | 53,733 | 33,302 | -37,288 | -61,587 | -31,646 | -4,497 | -16,812 | -29,000 | -36,959 | 16,706 | 20,743 |
| 2024 | 90,132 | 65,411 | 14,497 | -33,516 | -53,792 | -32,229 | -8,773 | -7,034 | -39,778 | -31,940 | 16,802 | 55,867 |
| 2025 | 102,640 | 73,909 | 5,515 | -29,147 | -60,948 | -42,622 | -8,333 | -32,392 | -44,429 | -29,946 | 4,710 | 66,874 |
| 2026 | 98,574 | 72,713 | 2,866 | -38,812 | ||||||||
| - = No Data Reported; -- = Not Applicable; NA = Not Available; W = Withheld to avoid disclosure of individual company data. |
| Release Date: 6/30/2026 |
| Next Release Date: 7/31/2026 |