|
Download Data (XLS File) |
|
||||||||
|
||||||||
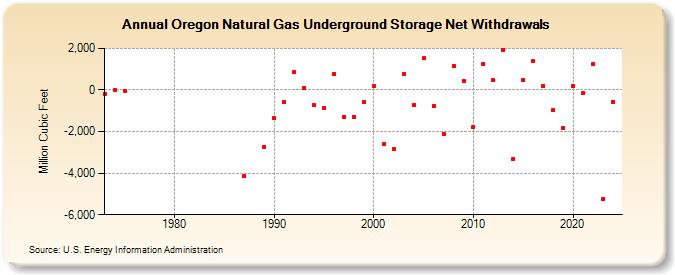
| Oregon Natural Gas Underground Storage Net Withdrawals (Million Cubic Feet) | ||||||||
| Decade | Year-0 | Year-1 | Year-2 | Year-3 | Year-4 | Year-5 | Year-6 | Year-7 | Year-8 | Year-9 |
|---|---|---|---|---|---|---|---|---|---|---|
| 1970's | -189 | -5 | -46 | |||||||
| 1980's | -4,148 | -2,721 | ||||||||
| 1990's | -1,363 | -566 | 872 | 100 | -720 | -880 | 783 | -1,316 | -1,278 | -589 |
| 2000's | 212 | -2,619 | -2,852 | 786 | -707 | 1,526 | -750 | -2,126 | 1,144 | 429 |
| 2010's | -1,786 | 1,271 | 463 | 1,938 | -3,318 | 474 | 1,381 | 214 | -955 | -1,844 |
| 2020's | 205 | -150 | 1,228 | -5,231 | -563 | -950 |
| - = No Data Reported; -- = Not Applicable; NA = Not Available; W = Withheld to avoid disclosure of individual company data. |
| Release Date: 6/30/2026 |
| Next Release Date: 7/31/2026 |