|
Download Data (XLS File) |
|
||||||||
|
||||||||
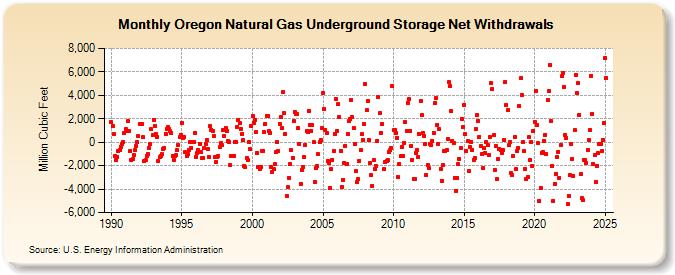
| Oregon Natural Gas Underground Storage Net Withdrawals (Million Cubic Feet) | ||||||||
| Year | Jan | Feb | Mar | Apr | May | Jun | Jul | Aug | Sep | Oct | Nov | Dec |
|---|---|---|---|---|---|---|---|---|---|---|---|---|
| 1990 | 1,698 | 1,339 | 698 | -1,181 | -1,508 | -1,244 | -764 | -636 | -372 | -188 | 45 | 751 |
| 1991 | 1,090 | 965 | 1,767 | 978 | -713 | -1,554 | -1,458 | -1,092 | -674 | -339 | -23 | 487 |
| 1992 | 1,568 | 1,540 | 1,586 | 443 | -1,572 | -1,540 | -1,194 | -1,010 | -453 | -173 | 1,100 | 579 |
| 1993 | 1,918 | 1,397 | 728 | 426 | -1,636 | -1,291 | -1,175 | -1,036 | -575 | -487 | 731 | 1,103 |
| 1994 | 1,262 | 1,126 | 946 | 820 | -1,216 | -1,506 | -1,202 | -1,081 | -688 | -255 | 437 | 638 |
| 1995 | 1,677 | 385 | 440 | -867 | -1,179 | -1,034 | -695 | 0 | -486 | 0 | 58 | 822 |
| 1996 | -1,252 | -940 | -651 | -132 | -841 | -1,365 | -1,318 | -509 | -121 | 170 | -552 | -1,240 |
| 1997 | 1,340 | 1,076 | 919 | 543 | -1,300 | -1,681 | -1,301 | -1,178 | -410 | -97 | -262 | 1,036 |
| 1998 | 534 | 1,238 | 923 | 80 | 0 | -1,968 | -1,188 | -1,143 | -1,141 | 9 | 49 | 1,329 |
| 1999 | 1,934 | 1,679 | 1,158 | 718 | 164 | -2,018 | -2,119 | -1,316 | -1,546 | 0 | -593 | 1,350 |
| 2000 | 2,214 | 1,660 | 1,872 | 830 | -893 | -2,101 | -2,270 | -2,074 | -720 | -720 | 849 | 1,565 |
| 2001 | 2,252 | 2,264 | 962 | 810 | -2,151 | -2,561 | -2,295 | -1,860 | -845 | 0 | -766 | 1,572 |
| 2002 | 2,124 | 1,183 | 4,263 | 2,457 | 732 | -4,579 | -3,856 | -3,051 | -1,900 | -699 | -1,318 | 1,792 |
| 2003 | 2,570 | 2,367 | 2,426 | 1,174 | -113 | -3,529 | -2,348 | -2,140 | -1,220 | -259 | 956 | 902 |
| 2004 | 2,680 | 1,501 | 941 | 1,477 | 8 | -3,386 | -2,223 | -2,022 | -1,044 | 0 | 159 | 1,203 |
| 2005 | 4,227 | 2,837 | 1,049 | 748 | -1,585 | -1,756 | -3,882 | -2,304 | -1,500 | -732 | 723 | 3,701 |
| 2006 | 976 | 3,233 | 2,165 | -711 | -3,807 | -3,204 | -1,737 | -314 | -1,818 | 706 | 1,788 | 1,975 |
| 2007 | 3,617 | 2,120 | 1,236 | -159 | -2,484 | -3,422 | -3,140 | -1,562 | -675 | 667 | 162 | 1,514 |
| 2008 | 4,923 | 2,722 | 3,476 | 213 | -1,803 | -2,786 | -3,702 | -1,527 | -2,250 | -2,069 | 132 | 3,815 |
| 2009 | 2,448 | 822 | 1,569 | -2,316 | -1,726 | -1,576 | -1,500 | -856 | -689 | -499 | 4,752 | |
| 2010 | 1,020 | 1,015 | 779 | 396 | -2,970 | -1,845 | -1,205 | -375 | -1,166 | -98 | 1,687 | 975 |
| 2011 | 3,350 | 3,660 | 992 | -334 | -1,480 | -3,108 | -3,180 | -920 | -639 | -1,248 | 668 | 3,508 |
| 2012 | 2,318 | 804 | 569 | -145 | -2,806 | -1,939 | -2,237 | -126 | -260 | 132 | 807 | 3,345 |
| 2013 | 3,762 | 1,505 | -111 | 1,108 | -2,269 | -3,284 | -1,962 | -782 | -728 | -668 | 258 | 5,108 |
| 2014 | 4,752 | 2,637 | 102 | -36 | -3,018 | -4,133 | -3,056 | -1,897 | -1,425 | -505 | 1,993 | 1,267 |
| 2015 | 3,212 | 688 | -732 | 116 | -2,416 | -374 | 2 | -685 | -1,482 | -1,330 | 1,139 | 2,338 |
| 2016 | 1,845 | 481 | -362 | -1,027 | -2,228 | -511 | -887 | -16 | -266 | -1,086 | 406 | 5,032 |
| 2017 | 4,500 | 606 | -2,364 | -336 | -3,170 | -1,472 | -545 | -702 | -899 | -705 | 190 | 5,113 |
| 2018 | 3,193 | 2,704 | -261 | 29 | -2,644 | -2,824 | -1,178 | 431 | -2,316 | -725 | -454 | 3,090 |
| 2019 | 5,447 | 4,007 | 15 | -750 | -2,302 | -3,170 | -2,991 | 418 | -1,508 | 17 | -1,987 | 958 |
| 2020 | 1,760 | 4,346 | 1,474 | -105 | -4,996 | -3,919 | -920 | -843 | 128 | 648 | -1,004 | 3,636 |
| 2021 | 4,348 | 6,615 | 1,782 | -2,001 | -5,017 | -3,529 | -2,675 | -1,281 | -803 | -3,016 | -214 | 5,641 |
| 2022 | 5,938 | 4,697 | 582 | 365 | -5,311 | -4,567 | -2,813 | -135 | -1,426 | -2,843 | 1,013 | 5,728 |
| 2023 | 4,166 | 5,032 | 2,355 | -2,750 | -4,794 | -4,965 | -1,510 | -1,550 | -1,789 | -638 | 165 | 1,047 |
| 2024 | 5,672 | 2,413 | -1,881 | -1,121 | -3,411 | -1,990 | -954 | -191 | -159 | -788 | 228 | 1,619 |
| 2025 | 7,210 | 5,455 | 103 | -1,218 | -4,642 | -5,170 | -1,783 | 793 | -644 | -998 | -1,171 | 1,115 |
| 2026 | 4,895 | 3,030 | -1,546 | -697 | ||||||||
| - = No Data Reported; -- = Not Applicable; NA = Not Available; W = Withheld to avoid disclosure of individual company data. |
| Release Date: 6/30/2026 |
| Next Release Date: 7/31/2026 |