|
Download Data (XLS File) |
|
||||||||
|
||||||||
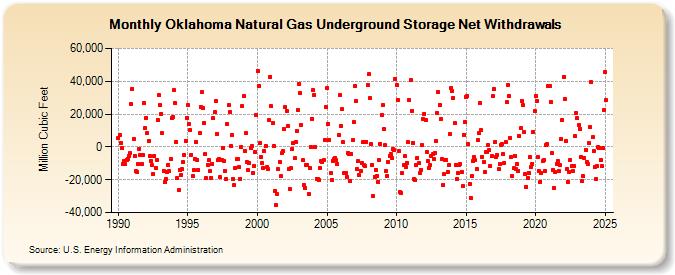
| Oklahoma Natural Gas Underground Storage Net Withdrawals (Million Cubic Feet) | ||||||||
| Year | Jan | Feb | Mar | Apr | May | Jun | Jul | Aug | Sep | Oct | Nov | Dec |
|---|---|---|---|---|---|---|---|---|---|---|---|---|
| 1990 | 5,526 | 7,239 | 2,427 | -885 | -10,341 | -8,861 | -10,616 | -7,700 | -7,151 | -5,802 | -3,986 | 25,852 |
| 1991 | 35,547 | 5,078 | -5,298 | -14,900 | -15,187 | -10,455 | -1,095 | -4,757 | -10,249 | -4,702 | 26,655 | 11,502 |
| 1992 | 17,866 | 8,339 | 3,738 | -5,813 | -8,448 | -11,329 | -16,356 | -5,444 | -12,709 | -7,728 | 16,578 | 31,363 |
| 1993 | 25,220 | 20,310 | 8,195 | -14,656 | -21,410 | -19,631 | -15,116 | -10,830 | -14,976 | -7,313 | 17,378 | 18,294 |
| 1994 | 34,379 | 26,584 | 3,144 | -18,906 | -26,542 | -14,012 | -17,293 | -13,744 | -9,237 | -4,797 | 3,825 | 17,759 |
| 1995 | 25,310 | 13,983 | 10,026 | -4,739 | -17,831 | -14,113 | -7,322 | 2,877 | -7,816 | -13,868 | 8,327 | 24,431 |
| 1996 | 33,230 | 23,470 | 14,679 | -4,435 | -19,131 | -10,949 | -8,211 | -14,973 | -18,814 | -10,345 | 17,468 | 20,970 |
| 1997 | 28,208 | 8,115 | -8,168 | -7,180 | -18,407 | -7,984 | -811 | -8,393 | -14,556 | -19,663 | 13,995 | 25,362 |
| 1998 | 21,282 | 715 | 7,174 | -19,472 | -23,402 | -12,648 | -7,570 | -7,283 | -12,262 | -19,358 | 106 | 24,711 |
| 1999 | 30,896 | -2,335 | 8,272 | -8,905 | -13,960 | -9,663 | -979 | 501 | -15,615 | -11,571 | -2,807 | 19,463 |
| 2000 | 46,411 | 36,885 | 2,136 | -6,249 | -9,598 | -12,742 | -2,396 | 660 | -12,480 | -13,209 | 16,307 | 42,630 |
| 2001 | 24,639 | 14,763 | 622 | -26,701 | -35,265 | -28,981 | -13,729 | -8,939 | -17,988 | -3,992 | -2,691 | 11,048 |
| 2002 | 24,156 | 21,868 | 12,862 | -13,382 | -25,759 | -13,139 | -1,094 | 2,096 | -6,965 | 3,238 | 9,873 | 22,547 |
| 2003 | 38,455 | 32,780 | 13,335 | -8,171 | -23,041 | -24,846 | -10,981 | -10,965 | -28,604 | -12,579 | -21 | 17,152 |
| 2004 | 34,428 | 31,718 | -100 | -19,278 | -19,657 | -20,287 | -12,753 | -8,459 | -9,185 | -8,060 | 4,337 | 24,133 |
| 2005 | 35,884 | 14,016 | 4,072 | -16,114 | -20,296 | -8,483 | -7,655 | -6,884 | -8,105 | -10,347 | 7,274 | 31,354 |
| 2006 | 12,663 | 22,786 | 2,727 | -15,804 | -15,870 | -18,292 | -3,489 | -4,264 | -20,629 | -4,264 | 4,101 | 15,260 |
| 2007 | 36,991 | 27,925 | -13,609 | -8,860 | -17,303 | -14,494 | -9,925 | 2,849 | -11,101 | -11,500 | 3,247 | 38,002 |
| 2008 | 44,165 | 29,480 | 1,591 | -10,767 | -30,164 | -18,107 | -13,849 | -17,561 | -21,310 | -8,242 | 1,821 | 19,693 |
| 2009 | 25,492 | 10,650 | 865 | -14,673 | -17,620 | -9,171 | -5,534 | -4,559 | -6,788 | -1,570 | -1,677 | 41,375 |
| 2010 | 37,775 | 28,633 | -2,786 | -27,618 | -27,900 | -15,798 | -11,259 | -5,611 | -12,512 | -9,549 | 2,806 | 28,338 |
| 2011 | 40,648 | 22,165 | 2,620 | -19,596 | -20,347 | -10,751 | -6,501 | -9,952 | -16,097 | -13,771 | 1,113 | 16,900 |
| 2012 | 20,290 | 16,571 | -2,850 | -8,445 | -12,763 | -11,214 | -5,527 | -4,605 | -7,391 | -3,824 | 3,288 | 20,694 |
| 2013 | 33,397 | 25,739 | 16,706 | -7,212 | -23,298 | -16,756 | -7,753 | -8,084 | -15,020 | -10,886 | 7,828 | 35,677 |
| 2014 | 33,969 | 29,979 | 14,326 | -10,928 | -19,840 | -16,051 | -10,836 | -10,561 | -15,412 | -24,105 | 7,444 | 15,204 |
| 2015 | 30,588 | 31,015 | 1,625 | -22,563 | -30,908 | -17,758 | -8,740 | -6,183 | -8,189 | -13,483 | 3,951 | 8,250 |
| 2016 | 26,725 | 10,070 | -5,923 | -9,402 | -15,348 | -3,069 | -3,398 | 1,055 | -2,082 | -11,783 | -5,705 | 30,817 |
| 2017 | 35,389 | 3,193 | -5,893 | -4,742 | -13,581 | -10,437 | 1,039 | 1,626 | -4,340 | -9,766 | 3,272 | 27,244 |
| 2018 | 37,977 | 31,221 | 5,470 | -6,196 | -17,878 | -13,098 | -5,348 | -13,480 | -10,303 | -14,498 | 6,616 | 11,329 |
| 2019 | 27,838 | 25,251 | 8,971 | -16,486 | -24,181 | -18,719 | -15,795 | -6,377 | -12,135 | -10,247 | 9,235 | 21,675 |
| 2020 | 30,914 | 27,662 | -6,319 | -14,811 | -21,149 | -15,991 | -8,719 | -7,967 | -14,440 | 949 | 1,470 | 37,084 |
| 2021 | 37,092 | 27,437 | -3,759 | -13,774 | -24,755 | -15,306 | -10,467 | -8,363 | -14,888 | -11,300 | 4,766 | 16,453 |
| 2022 | 42,836 | 29,223 | 3,403 | -13,344 | -21,435 | -15,279 | -7,923 | -11,709 | -14,731 | -11,346 | 6,589 | 20,697 |
| 2023 | 17,364 | 13,444 | 10,984 | -5,934 | -20,955 | -17,890 | -6,601 | -1,738 | -9,176 | -10,503 | 2,245 | 12,038 |
| 2024 | 39,306 | 5,827 | -2,572 | -11,962 | -19,505 | -11,503 | -45 | -585 | -7,760 | -11,706 | -921 | 22,525 |
| 2025 | 45,662 | 28,304 | -7,077 | -20,230 | -27,623 | -20,792 | -39 | 4,073 | -10,775 | -12,695 | 1,129 | 30,278 |
| 2026 | 36,222 | 14,358 | -5,993 | -16,741 | ||||||||
| - = No Data Reported; -- = Not Applicable; NA = Not Available; W = Withheld to avoid disclosure of individual company data. |
| Release Date: 6/30/2026 |
| Next Release Date: 7/31/2026 |