|
Download Data (XLS File) |
|
||||||||
|
||||||||
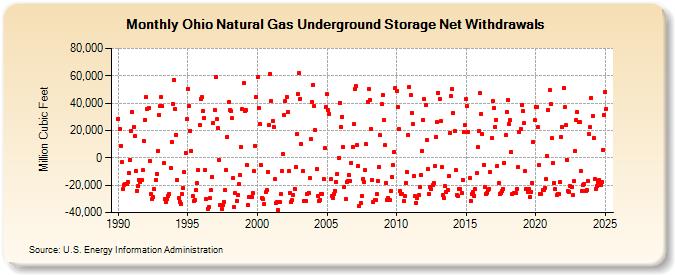
| Ohio Natural Gas Underground Storage Net Withdrawals (Million Cubic Feet) | ||||||||
| Year | Jan | Feb | Mar | Apr | May | Jun | Jul | Aug | Sep | Oct | Nov | Dec |
|---|---|---|---|---|---|---|---|---|---|---|---|---|
| 1990 | 28,671 | 21,104 | 8,786 | -3,004 | -22,591 | -19,754 | -19,422 | -19,035 | -17,413 | -11,060 | -1,578 | 19,963 |
| 1991 | 33,610 | 22,881 | 15,733 | -9,676 | -23,939 | -20,435 | -16,173 | -17,817 | -16,055 | -9,113 | 12,644 | 27,910 |
| 1992 | 44,471 | 35,632 | 36,501 | -2,246 | -26,466 | -29,912 | -28,770 | -23,106 | -15,846 | -11,598 | 5,352 | 31,661 |
| 1993 | 37,880 | 44,150 | 37,556 | -3,716 | -30,319 | -32,498 | -29,821 | -27,642 | -26,300 | -7,245 | 11,570 | 39,653 |
| 1994 | 57,211 | 35,630 | 17,022 | -15,965 | -29,636 | -31,935 | -33,557 | -26,755 | -21,945 | -10,528 | 3,858 | 28,025 |
| 1995 | 50,411 | 37,831 | 19,862 | 5,084 | -28,031 | -31,750 | -30,964 | -23,432 | -18,579 | -8,835 | 24,176 | 43,090 |
| 1996 | 44,205 | 33,937 | 29,225 | -8,729 | -30,055 | -37,165 | -36,092 | -29,581 | -23,807 | -13,648 | 25,728 | 35,138 |
| 1997 | 58,753 | 28,161 | 21,559 | -1,447 | -34,205 | -37,483 | -34,224 | -32,174 | -23,499 | -8,809 | 15,502 | 40,530 |
| 1998 | 35,002 | 34,200 | 28,785 | -14,843 | -36,194 | -26,039 | -31,408 | -27,403 | -19,356 | -12,789 | 7,882 | 35,491 |
| 1999 | 54,840 | 34,280 | 34,933 | -5,265 | -34,597 | -28,724 | -28,566 | -28,634 | -25,793 | -9,815 | 8,737 | 44,624 |
| 2000 | 59,220 | 36,791 | 24,381 | -5,232 | -29,262 | -30,291 | -33,397 | -25,180 | -23,823 | -10,060 | 24,034 | 61,149 |
| 2001 | 41,627 | 27,041 | 22,798 | -15,810 | -33,196 | -32,405 | -37,999 | -32,365 | -26,448 | -9,862 | 2,925 | 30,969 |
| 2002 | 41,659 | 44,671 | 33,269 | -9,909 | -25,818 | -32,190 | -31,089 | -27,116 | -22,458 | -6,995 | 17,435 | 46,875 |
| 2003 | 62,002 | 43,314 | 10,463 | -9,789 | -31,723 | -31,526 | -31,747 | -26,603 | -25,377 | -14,886 | 13,417 | 40,822 |
| 2004 | 53,518 | 37,598 | 20,210 | -8,139 | -27,981 | -31,786 | -30,722 | -26,077 | -26,185 | -15,457 | 7,113 | 37,072 |
| 2005 | 46,310 | 34,770 | 32,015 | -15,704 | -27,993 | -29,191 | -26,262 | -24,081 | -17,530 | -11,608 | 89 | 40,288 |
| 2006 | 22,371 | 30,194 | 7,883 | -21,631 | -30,268 | -17,586 | -16,871 | -12,457 | -17,057 | -3,751 | 8,034 | 24,453 |
| 2007 | 50,537 | 52,319 | 9,049 | -6,052 | -35,332 | -32,818 | -27,585 | -15,523 | -17,690 | -9,181 | 9,832 | 41,157 |
| 2008 | 50,423 | 42,406 | 21,267 | -15,961 | -32,374 | -30,919 | -31,157 | -26,770 | -17,027 | -6,365 | 16,367 | 39,227 |
| 2009 | 46,254 | 27,808 | 9,082 | -18,218 | -30,740 | -29,361 | -30,573 | -24,171 | -13,931 | -5,333 | 4,275 | 51,152 |
| 2010 | 49,036 | 37,117 | 21,135 | -23,904 | -26,415 | -26,389 | -31,380 | -28,120 | -18,349 | -10,572 | 16,565 | 52,044 |
| 2011 | 46,117 | 33,106 | 24,510 | -13,106 | -28,139 | -33,030 | -29,034 | -27,385 | -21,511 | -12,695 | 5,139 | 28,011 |
| 2012 | 42,737 | 38,491 | 13,190 | -8,077 | -26,578 | -21,443 | -23,125 | -19,714 | -18,305 | -6,203 | 15,256 | 25,904 |
| 2013 | 47,599 | 42,934 | 26,607 | -7,043 | -27,010 | -29,588 | -20,779 | -25,333 | -23,215 | -13,318 | 18,477 | 45,160 |
| 2014 | 50,540 | 32,485 | 19,863 | -9,245 | -27,166 | -28,204 | -22,917 | -22,667 | -25,383 | -15,873 | 18,676 | 23,765 |
| 2015 | 42,969 | 37,546 | 19,170 | -14,797 | -31,413 | -26,651 | -25,160 | -27,651 | -22,886 | -11,308 | 7,717 | 19,441 |
| 2016 | 47,082 | 32,160 | 17,603 | -5,040 | -21,537 | -26,258 | -25,774 | -23,658 | -22,602 | -10,323 | 14,460 | 41,276 |
| 2017 | 36,350 | 22,619 | 27,859 | -5,818 | -18,721 | -26,200 | -26,059 | -24,349 | -22,590 | -3,490 | 16,388 | 33,605 |
| 2018 | 42,463 | 24,424 | 27,353 | 4,379 | -26,345 | -25,869 | -25,872 | -25,825 | -22,743 | -7,023 | 18,578 | 21,319 |
| 2019 | 38,856 | 34,073 | 25,100 | -9,978 | -22,804 | -25,172 | -23,011 | -28,593 | -24,910 | -18,142 | 11,806 | 27,435 |
| 2020 | 37,188 | 37,230 | 22,278 | -5,329 | -26,555 | -26,693 | -23,579 | -23,566 | -21,735 | -15,732 | 1,241 | 35,053 |
| 2021 | 49,454 | 39,180 | 14,441 | -3,490 | -18,130 | -22,955 | -27,181 | -26,253 | -26,141 | -17,740 | 14,986 | 22,503 |
| 2022 | 51,179 | 36,952 | 23,642 | -1,317 | -24,494 | -24,892 | -20,888 | -21,670 | -27,394 | -17,214 | 5,261 | 27,818 |
| 2023 | 33,182 | 26,071 | 25,849 | -9,289 | -23,993 | -19,989 | -19,261 | -24,015 | -23,656 | -17,159 | 17,303 | 22,287 |
| 2024 | 43,745 | 30,539 | 14,597 | -15,385 | -22,947 | -20,684 | -17,301 | -16,209 | -20,074 | -17,629 | 6,019 | 31,462 |
| 2025 | 48,331 | 35,964 | 18,622 | -6,515 | -25,123 | -22,415 | -19,196 | -25,080 | -25,287 | -11,150 | 11,044 | 30,384 |
| 2026 | 42,396 | 31,230 | 17,579 | -9,373 | ||||||||
| - = No Data Reported; -- = Not Applicable; NA = Not Available; W = Withheld to avoid disclosure of individual company data. |
| Release Date: 6/30/2026 |
| Next Release Date: 7/31/2026 |