|
Download Data (XLS File) |
|
||||||||
|
||||||||
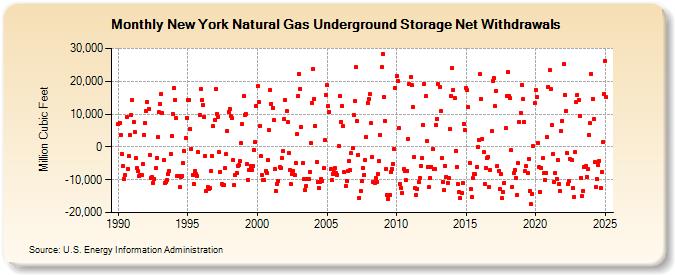
| New York Natural Gas Underground Storage Net Withdrawals (Million Cubic Feet) | ||||||||
| Year | Jan | Feb | Mar | Apr | May | Jun | Jul | Aug | Sep | Oct | Nov | Dec |
|---|---|---|---|---|---|---|---|---|---|---|---|---|
| 1990 | 6,978 | 7,211 | 3,688 | -2,024 | -5,813 | -9,881 | -8,650 | 9,098 | -6,725 | -2,817 | 3,609 | 9,671 |
| 1991 | 14,187 | 7,725 | 4,555 | -3,535 | -6,425 | -7,492 | -9,006 | -8,498 | -8,681 | -5,237 | 3,662 | 7,125 |
| 1992 | 11,051 | 13,614 | 11,629 | -2,328 | -9,430 | -9,127 | -10,849 | -9,745 | -6,488 | -3,455 | 3,023 | 10,534 |
| 1993 | 13,008 | 16,042 | 10,253 | -3,979 | -10,916 | -10,768 | -10,108 | -8,284 | -7,373 | -2,085 | 3,382 | 9,939 |
| 1994 | 17,959 | 14,320 | 8,773 | -8,999 | -8,805 | -12,251 | -9,125 | -8,906 | -5,006 | -1,373 | 2,674 | 8,913 |
| 1995 | 14,134 | 14,339 | 5,507 | -600 | -8,564 | -11,189 | -7,285 | -8,274 | -8,910 | -1,689 | 9,671 | 17,605 |
| 1996 | 14,174 | 12,756 | 8,971 | -2,711 | -13,349 | -12,079 | -12,964 | -12,585 | -7,327 | -2,750 | 6,347 | 8,151 |
| 1997 | 17,664 | 10,141 | 9,239 | -1,623 | -7,589 | -11,184 | -11,663 | -11,606 | -6,455 | -2,211 | 4,857 | 10,735 |
| 1998 | 11,466 | 9,298 | 8,738 | -4,090 | -11,697 | -8,569 | -7,931 | -5,731 | -5,650 | -4,424 | 1,047 | 6,889 |
| 1999 | 15,499 | 9,840 | 10,065 | -5,300 | -9,939 | -6,912 | -5,916 | -6,898 | -5,728 | -948 | 1,488 | 12,574 |
| 2000 | 18,460 | 13,703 | 6,361 | -2,847 | -8,664 | -10,009 | -10,091 | -7,493 | -7,909 | -4,026 | 5,062 | 17,276 |
| 2001 | 13,140 | 11,927 | 8,165 | -6,631 | -13,547 | -11,216 | -10,236 | -6,260 | -6,342 | -3,375 | -1,338 | 8,569 |
| 2002 | 14,392 | 10,880 | 7,448 | -1,756 | -6,987 | -11,255 | -8,313 | -7,293 | -8,707 | -4,953 | 3,786 | 15,568 |
| 2003 | 22,151 | 17,730 | 6,003 | -4,999 | -9,786 | -13,105 | -11,871 | -9,714 | -9,733 | -7,556 | 1,217 | 13,299 |
| 2004 | 23,686 | 14,634 | 6,405 | -4,618 | -10,640 | -12,478 | -10,597 | -9,668 | -10,308 | -6,474 | 2,004 | 15,932 |
| 2005 | 18,738 | 12,313 | 10,769 | -6,786 | -10,202 | -8,395 | -7,788 | -6,438 | -7,862 | -8,446 | 193 | 15,443 |
| 2006 | 7,660 | 12,551 | 6,310 | -7,791 | -11,875 | -10,257 | -7,460 | -4,246 | -7,135 | -1,941 | -480 | 9,592 |
| 2007 | 13,869 | 24,231 | 7,807 | -2,414 | -15,477 | -13,386 | -10,539 | -6,373 | -8,518 | -3,931 | 3,053 | 13,416 |
| 2008 | 14,638 | 15,981 | 7,199 | -3,134 | -10,722 | -10,914 | -9,500 | -10,608 | -8,180 | -4,446 | 3,743 | 24,200 |
| 2009 | 28,291 | 15,217 | 7,913 | -6,771 | -14,643 | -15,922 | -14,654 | -7,753 | -6,583 | -5,075 | -639 | 18,066 |
| 2010 | 21,659 | 19,958 | 5,706 | -11,309 | -12,536 | -14,041 | -6,662 | -7,346 | -10,173 | -7,196 | 2,447 | 19,013 |
| 2011 | 21,192 | 18,706 | 12,161 | -3,086 | -12,453 | -14,796 | -12,830 | -10,822 | -9,536 | -5,781 | -3,442 | 6,740 |
| 2012 | 19,158 | 15,407 | 1,701 | -6,042 | -12,261 | -9,369 | -6,017 | -677 | -6,865 | -6,803 | 6,695 | 8,609 |
| 2013 | 19,053 | 18,361 | 10,854 | -3,275 | -10,599 | -13,117 | -5,750 | -9,035 | -10,891 | -9,593 | 5,506 | 15,485 |
| 2014 | 24,017 | 17,329 | 14,829 | -1,276 | -6,000 | -11,399 | -13,780 | -15,669 | -14,041 | -11,131 | 7,036 | 5,228 |
| 2015 | 17,951 | 17,191 | 12,169 | -4,764 | -12,852 | -15,297 | -9,553 | -8,289 | -8,376 | -6,129 | 7 | 2,020 |
| 2016 | 22,150 | 14,571 | 2,483 | -1,560 | -11,257 | -6,284 | -3,467 | -3,017 | -12,209 | -7,006 | 4,697 | 20,132 |
| 2017 | 20,857 | 12,369 | 17,047 | -5,894 | -7,272 | -12,765 | -8,367 | -15,700 | -13,746 | -10,854 | 5,738 | 15,467 |
| 2018 | 22,793 | 15,424 | 14,822 | -952 | -12,164 | -8,007 | -6,908 | -9,405 | -14,541 | -4,921 | 7,608 | 10,444 |
| 2019 | 18,955 | 14,552 | 7,677 | -7,371 | -5,889 | -7,902 | -3,597 | -13,493 | -17,487 | -14,260 | 176 | 13,325 |
| 2020 | 17,449 | 15,319 | 1,299 | -6,240 | -13,599 | -6,309 | -3,460 | -8,078 | -9,947 | -8,027 | 2,928 | 18,349 |
| 2021 | 23,290 | 17,547 | 6,696 | -2,157 | -10,570 | -7,984 | -9,638 | -3,854 | -11,164 | -13,435 | 4,794 | 7,927 |
| 2022 | 25,200 | 15,943 | 11,001 | -1,883 | -11,430 | -10,404 | -3,787 | -3,885 | -12,521 | -15,253 | -1,500 | 13,641 |
| 2023 | 15,923 | 14,364 | 9,418 | -9,356 | -14,987 | -13,340 | -6,134 | -5,907 | -9,078 | -6,869 | 3,740 | 7,191 |
| 2024 | 22,232 | 14,635 | 8,391 | -4,618 | -12,277 | -9,720 | -5,434 | -4,251 | -12,576 | -7,637 | 1,350 | 16,185 |
| 2025 | 26,216 | 15,086 | 3,185 | -6,801 | -14,561 | -9,745 | -2,385 | -7,080 | -10,487 | -9,397 | 1,485 | 15,814 |
| 2026 | 22,077 | 18,667 | 9,861 | -8,341 | ||||||||
| - = No Data Reported; -- = Not Applicable; NA = Not Available; W = Withheld to avoid disclosure of individual company data. |
| Release Date: 6/30/2026 |
| Next Release Date: 7/31/2026 |