|
Download Data (XLS File) |
|
||||||||
|
||||||||
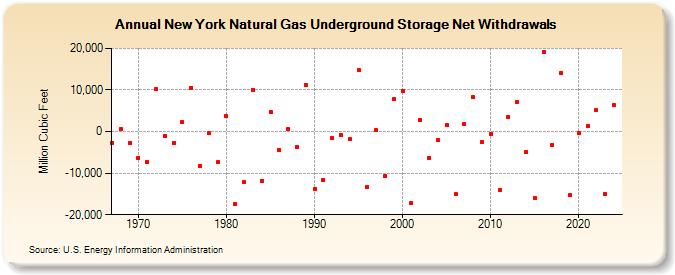
| New York Natural Gas Underground Storage Net Withdrawals (Million Cubic Feet) | ||||||||
| Decade | Year-0 | Year-1 | Year-2 | Year-3 | Year-4 | Year-5 | Year-6 | Year-7 | Year-8 | Year-9 |
|---|---|---|---|---|---|---|---|---|---|---|
| 1960's | -2,728 | 504 | -2,726 | |||||||
| 1970's | -6,261 | -7,419 | 10,117 | -1,160 | -2,691 | 2,291 | 10,590 | -8,296 | -454 | -7,418 |
| 1980's | 3,663 | -17,360 | -12,222 | 10,099 | -11,795 | 4,767 | -4,489 | 636 | -3,598 | 11,218 |
| 1990's | -13,848 | -11,619 | -1,572 | -889 | -1,824 | 14,746 | -13,367 | 304 | -10,656 | 7,825 |
| 2000's | 9,824 | -17,144 | 2,810 | -6,363 | -2,123 | 1,539 | -15,072 | 1,737 | 8,256 | -2,552 |
| 2010's | -481 | -13,947 | 3,535 | 7,000 | -4,857 | -15,923 | 19,233 | -3,120 | 14,193 | -15,314 |
| 2020's | -317 | 1,451 | 5,122 | -15,036 | 6,281 | 1,332 |
| - = No Data Reported; -- = Not Applicable; NA = Not Available; W = Withheld to avoid disclosure of individual company data. |
| Release Date: 6/30/2026 |
| Next Release Date: 7/31/2026 |