|
Download Data (XLS File) |
|
||||||||
|
||||||||
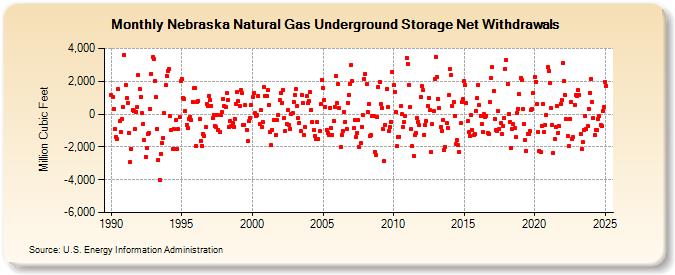
| Nebraska Natural Gas Underground Storage Net Withdrawals (Million Cubic Feet) | ||||||||
| Year | Jan | Feb | Mar | Apr | May | Jun | Jul | Aug | Sep | Oct | Nov | Dec |
|---|---|---|---|---|---|---|---|---|---|---|---|---|
| 1990 | 1,156 | 1,047 | 309 | -913 | -1,378 | -1,530 | 1,525 | -446 | -1,097 | -304 | 405 | 3,601 |
| 1991 | 1,796 | 1,007 | 697 | -1,133 | -2,906 | -2,128 | 253 | 167 | -901 | 154 | 402 | 2,362 |
| 1992 | 1,540 | 1,041 | 46 | -604 | -1,609 | -2,611 | -2,083 | -1,187 | -1,167 | 316 | 2,461 | 3,451 |
| 1993 | 3,338 | 2,006 | 1,018 | -909 | -2,779 | -4,020 | -2,407 | -1,740 | -1,442 | 66 | 1,763 | 2,339 |
| 1994 | 2,628 | 2,733 | -143 | -959 | -2,138 | -897 | -2,125 | -336 | -2,125 | -930 | -182 | 2,003 |
| 1995 | 2,118 | 998 | 933 | 200 | -643 | -866 | -278 | -177 | -385 | 745 | 1,602 | 1,597 |
| 1996 | -1,937 | 754 | 802 | -303 | -1,617 | -1,924 | -1,193 | -1,346 | -785 | 600 | 479 | 1,108 |
| 1997 | 865 | 502 | -245 | -47 | -714 | -803 | -76 | -971 | -1,099 | -69 | 124 | 944 |
| 1998 | 490 | 425 | 1,261 | 860 | -773 | -422 | -727 | -524 | -778 | -308 | 625 | 1,336 |
| 1999 | 772 | 500 | 1,447 | 1,266 | -655 | -651 | 522 | -949 | -1,645 | -440 | -252 | 557 |
| 2000 | 1,019 | 1,313 | 43 | -92 | -78 | 1,077 | -620 | 225 | -764 | -503 | 1,622 | 1,124 |
| 2001 | 1,090 | 1,456 | 573 | -1,077 | -1,908 | -956 | -339 | -364 | -1,250 | -361 | -45 | 831 |
| 2002 | 1,255 | 673 | 1,459 | -253 | -1,017 | -588 | 237 | -692 | -906 | 3 | 57 | 755 |
| 2003 | 1,170 | 1,512 | 504 | -248 | -537 | -1,004 | 1,146 | 651 | -1,291 | -814 | 1,113 | 652 |
| 2004 | 797 | 1,317 | 277 | -472 | -968 | -1,329 | -1,505 | -488 | -1,506 | -1,046 | 589 | 2,092 |
| 2005 | 1,615 | 868 | 460 | -949 | -1,131 | -1,265 | 385 | -859 | -1,267 | -407 | 432 | 2,312 |
| 2006 | 647 | 1,814 | 346 | -1,993 | -1,249 | -1,016 | 114 | -454 | -882 | 698 | 1,158 | 1,816 |
| 2007 | 2,995 | 2,013 | -867 | -390 | -1,416 | -1,152 | -385 | -2,029 | -1,767 | -788 | -63 | 2,159 |
| 2008 | 2,438 | 1,815 | 138 | 620 | -1,311 | -1,292 | -101 | -123 | -2,288 | -2,479 | -204 | 1,653 |
| 2009 | 1,967 | 625 | 390 | -937 | -2,858 | -637 | 1,533 | 400 | -1,018 | -816 | -459 | 2,563 |
| 2010 | 1,742 | 1,365 | 112 | -1,960 | -1,378 | -1,367 | 480 | -14 | -763 | -495 | -99 | 3,421 |
| 2011 | 3,076 | 1,791 | 419 | -938 | -1,955 | -2,527 | -1,303 | -1,176 | -214 | -455 | -694 | 1,053 |
| 2012 | 1,698 | 1,437 | -1,246 | -653 | -431 | 486 | 985 | 236 | -2,300 | -616 | 159 | 2,141 |
| 2013 | 3,501 | 2,280 | 921 | 349 | -807 | -1,012 | -372 | -2,178 | -1,979 | -560 | -844 | 1,141 |
| 2014 | 2,728 | 2,400 | 498 | 761 | -94 | -1,809 | -1,589 | -1,907 | -2,299 | -574 | 719 | 888 |
| 2015 | 1,989 | 1,778 | 669 | -417 | -1,121 | -1,343 | -77 | -965 | -1,296 | -1,193 | 212 | 979 |
| 2016 | 1,788 | 549 | -103 | -630 | -1,099 | -16 | -151 | -90 | -1,132 | -1,221 | 721 | 2,171 |
| 2017 | 2,844 | 1,408 | -287 | -979 | -1,017 | 182 | -935 | -564 | -1,206 | -702 | -232 | 2,753 |
| 2018 | 3,298 | 1,856 | 1 | -472 | -2,061 | -887 | -633 | -839 | -1,400 | 64 | 327 | 1,209 |
| 2019 | 2,218 | 2,061 | 304 | -604 | -1,551 | -2,241 | -1,188 | -1,218 | -1,028 | 275 | 310 | 1,296 |
| 2020 | 2,242 | 1,976 | 591 | -1,101 | -2,232 | -2,341 | -711 | 634 | -1,093 | -644 | -36 | 2,851 |
| 2021 | 2,631 | 1,895 | 368 | -664 | -2,385 | -1,490 | -812 | 498 | -1,139 | -757 | 638 | 875 |
| 2022 | 3,102 | 1,986 | 1,154 | -329 | -1,335 | -1,946 | -283 | 764 | -1,524 | -1,424 | 572 | 1,157 |
| 2023 | 1,128 | 1,459 | 1,186 | -1,201 | -2,131 | -1,725 | -971 | -88 | -911 | -757 | 335 | 1,306 |
| 2024 | 2,158 | 728 | -245 | -1,267 | -958 | -994 | -282 | -145 | -680 | -749 | 158 | 439 |
| 2025 | 1,979 | 1,731 | -99 | -417 | -1,036 | -1,154 | -290 | 287 | 4 | -357 | -142 | 229 |
| 2026 | 1,869 | 908 | -40 | -391 | ||||||||
| - = No Data Reported; -- = Not Applicable; NA = Not Available; W = Withheld to avoid disclosure of individual company data. |
| Release Date: 6/30/2026 |
| Next Release Date: 7/31/2026 |