|
Download Data (XLS File) |
|
||||||||
|
||||||||
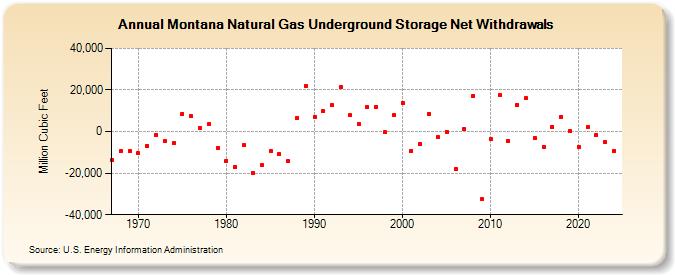
| Montana Natural Gas Underground Storage Net Withdrawals (Million Cubic Feet) | ||||||||
| Decade | Year-0 | Year-1 | Year-2 | Year-3 | Year-4 | Year-5 | Year-6 | Year-7 | Year-8 | Year-9 |
|---|---|---|---|---|---|---|---|---|---|---|
| 1960's | -13,819 | -9,389 | -9,555 | |||||||
| 1970's | -10,476 | -6,804 | -1,520 | -4,565 | -5,444 | 8,635 | 7,341 | 1,690 | 3,586 | -7,757 |
| 1980's | -14,116 | -17,139 | -6,459 | -20,041 | -16,237 | -9,425 | -10,864 | -14,297 | 6,570 | 22,058 |
| 1990's | 7,138 | 9,737 | 12,602 | 21,308 | 7,819 | 3,599 | 11,725 | 11,962 | -400 | 7,884 |
| 2000's | 13,911 | -9,198 | -5,933 | 8,564 | -2,647 | -19 | -17,896 | 1,292 | 17,270 | -32,563 |
| 2010's | -3,718 | 17,556 | -4,323 | 12,926 | 16,007 | -3,197 | -7,364 | 2,360 | 7,240 | 402 |
| 2020's | -7,211 | 2,204 | -1,731 | -5,223 | -9,238 | 5,121 |
| - = No Data Reported; -- = Not Applicable; NA = Not Available; W = Withheld to avoid disclosure of individual company data. |
| Release Date: 6/30/2026 |
| Next Release Date: 7/31/2026 |