|
Download Data (XLS File) |
|
||||||||
|
||||||||
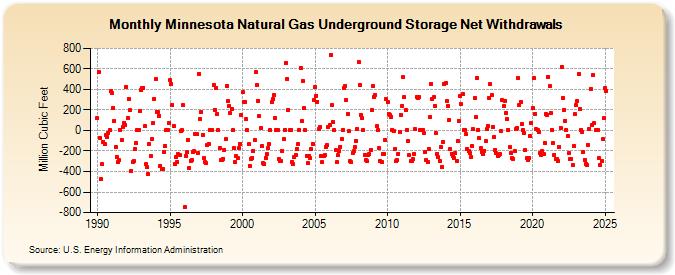
| Minnesota Natural Gas Underground Storage Net Withdrawals (Million Cubic Feet) | ||||||||
| Year | Jan | Feb | Mar | Apr | May | Jun | Jul | Aug | Sep | Oct | Nov | Dec |
|---|---|---|---|---|---|---|---|---|---|---|---|---|
| 1990 | 120 | 567 | -69 | -477 | -330 | -112 | -133 | -48 | -61 | -27 | 3 | 387 |
| 1991 | 361 | 223 | 96 | -160 | -257 | -312 | -291 | 4 | -93 | 32 | 77 | 53 |
| 1992 | 426 | 123 | 311 | 198 | -391 | -307 | -299 | -184 | -126 | 4 | 7 | 193 |
| 1993 | 395 | 417 | 417 | 41 | -331 | -358 | -426 | -134 | -248 | -87 | 75 | 310 |
| 1994 | 497 | 184 | 180 | 145 | -342 | -374 | -371 | -207 | -150 | 2 | 3 | 68 |
| 1995 | 491 | 456 | 246 | 44 | -331 | -262 | -306 | -234 | -241 | -6 | 2 | 245 |
| 1996 | -748 | -250 | -213 | -90 | -366 | -294 | -287 | -213 | -202 | -35 | -30 | -218 |
| 1997 | 551 | 109 | 177 | -40 | -273 | -312 | -321 | -142 | -130 | 0 | 4 | 4 |
| 1998 | 444 | 203 | 416 | 159 | 0 | -169 | -289 | -284 | -275 | -187 | -84 | 438 |
| 1999 | 287 | 238 | 167 | 214 | 0 | -172 | -308 | -250 | -272 | -175 | -128 | 147 |
| 2000 | 376 | 280 | 282 | 109 | 2 | -132 | -343 | -277 | -266 | -199 | -92 | 567 |
| 2001 | 440 | 291 | 139 | 21 | -152 | -319 | -329 | -266 | -232 | -174 | -135 | 3 |
| 2002 | 279 | 305 | 344 | 123 | 0 | 0 | -277 | -295 | -300 | -198 | -85 | 5 |
| 2003 | 659 | 504 | 199 | 0 | 0 | -309 | -331 | -259 | -239 | -176 | -135 | 4 |
| 2004 | 612 | 88 | 484 | 215 | 0 | -245 | -321 | -251 | -271 | -184 | -128 | 299 |
| 2005 | 422 | 340 | 278 | 18 | 36 | -244 | -311 | -244 | -243 | -157 | -143 | 32 |
| 2006 | 52 | 740 | 244 | 81 | 0 | -191 | -311 | -242 | -202 | -158 | -81 | 5 |
| 2007 | 412 | 432 | 293 | 165 | -9 | -300 | -310 | -220 | -204 | -163 | -98 | 14 |
| 2008 | 666 | 446 | 155 | 120 | 0 | -238 | -287 | -301 | -238 | -233 | -190 | 198 |
| 2009 | 431 | 331 | 346 | 39 | 0 | -174 | -302 | -309 | -231 | -229 | -89 | 306 |
| 2010 | 279 | 158 | 154 | 135 | 6 | -6 | -182 | -296 | -292 | -226 | -19 | 155 |
| 2011 | 242 | 518 | 326 | 201 | 6 | -102 | -242 | -301 | -293 | -281 | -229 | 11 |
| 2012 | 330 | 314 | 322 | 6 | 6 | 6 | -28 | -210 | -287 | -304 | -180 | 130 |
| 2013 | 453 | 307 | 322 | 243 | -28 | -226 | -263 | -302 | -162 | -358 | -112 | 455 |
| 2014 | 461 | 284 | 240 | 104 | -184 | -225 | -247 | -269 | -223 | -294 | -107 | 97 |
| 2015 | 337 | 255 | 351 | 6 | 6 | -37 | -176 | -202 | -219 | -262 | -149 | 10 |
| 2016 | 315 | 127 | 515 | 7 | -76 | -174 | -205 | -228 | -197 | -104 | 14 | 44 |
| 2017 | 321 | 450 | 342 | 36 | -63 | -190 | -220 | -244 | -242 | -232 | -9 | 298 |
| 2018 | 238 | 290 | 175 | 112 | 6 | -162 | -221 | -269 | -279 | -196 | 10 | 22 |
| 2019 | 512 | 250 | 277 | 59 | 6 | -23 | -192 | -273 | -288 | -270 | -52 | 70 |
| 2020 | 216 | 512 | 164 | 14 | 6 | -17 | -221 | -236 | -203 | -228 | -118 | 163 |
| 2021 | 155 | 526 | 430 | 169 | 6 | -120 | -237 | -278 | -279 | -293 | -160 | 28 |
| 2022 | 623 | 317 | 204 | 97 | 6 | -52 | -223 | -275 | -279 | -337 | -149 | 157 |
| 2023 | 244 | 286 | 549 | 207 | 6 | -17 | -210 | -285 | -325 | -339 | -138 | 17 |
| 2024 | 408 | 58 | 536 | 72 | 6 | 6 | 6 | -271 | -334 | -302 | -86 | 124 |
| 2025 | 415 | 388 | 292 | 408 | 58 | 45 | -371 | -347 | -422 | -389 | -110 | 312 |
| 2026 | 555 | 252 | 454 | 172 | ||||||||
| - = No Data Reported; -- = Not Applicable; NA = Not Available; W = Withheld to avoid disclosure of individual company data. |
| Release Date: 6/30/2026 |
| Next Release Date: 7/31/2026 |