|
Download Data (XLS File) |
|
||||||||
|
||||||||
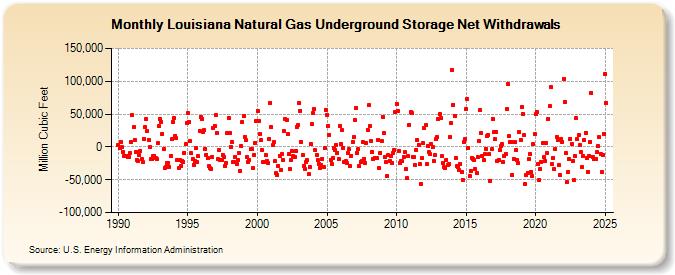
| Louisiana Natural Gas Underground Storage Net Withdrawals (Million Cubic Feet) | ||||||||
| Year | Jan | Feb | Mar | Apr | May | Jun | Jul | Aug | Sep | Oct | Nov | Dec |
|---|---|---|---|---|---|---|---|---|---|---|---|---|
| 1990 | 2,439 | -2,074 | 8,109 | -669 | -7,057 | -14,173 | -13,823 | -13,760 | -14,705 | -15,181 | -9,069 | 7,072 |
| 1991 | 48,879 | 30,368 | 10,947 | -7,292 | -19,263 | -22,117 | -11,877 | -6,029 | -18,632 | -23,315 | 12,743 | 30,577 |
| 1992 | 42,343 | 24,031 | 10,774 | -719 | -19,021 | -18,063 | -13,811 | -13,386 | -16,545 | -18,911 | 5,495 | 31,771 |
| 1993 | 42,366 | 38,260 | 19,889 | -2,835 | -32,284 | -30,354 | -24,018 | -23,797 | -30,732 | -13,548 | 11,601 | 37,815 |
| 1994 | 43,332 | 17,225 | 13,173 | -20,332 | -32,189 | -20,626 | -28,666 | -20,856 | -22,378 | -8,896 | 4,098 | 36,322 |
| 1995 | 50,996 | 38,571 | 8,326 | -9,723 | -18,801 | -27,559 | -20,851 | -1,207 | -23,381 | -14,079 | 24,216 | 46,245 |
| 1996 | 43,064 | 23,235 | 25,245 | -2,727 | -11,703 | -16,986 | -29,380 | -32,218 | -33,463 | -15,704 | 29,327 | 32,273 |
| 1997 | 48,043 | 20,943 | -18,885 | -3,990 | -19,573 | -19,809 | -11,847 | -15,446 | -29,291 | -24,035 | 20,997 | 43,644 |
| 1998 | 21,556 | 264 | 7,319 | -23,161 | -22,813 | -14,745 | -25,554 | -20,195 | -9,007 | -36,341 | 1,355 | 38,463 |
| 1999 | 46,564 | 15,818 | 10,038 | -15,120 | -22,462 | -20,249 | -3,692 | -3,887 | -32,398 | -11,735 | 6,656 | 39,997 |
| 2000 | 55,072 | 39,709 | 20,254 | 10,011 | -4,848 | -22,813 | -23,235 | -12,990 | -20,965 | -23,895 | 12,336 | 67,565 |
| 2001 | 30,123 | 2,218 | 7,263 | -21,920 | -40,248 | -42,731 | -28,898 | -13,447 | -34,949 | -11,123 | -20,241 | 23,713 |
| 2002 | 42,209 | 41,132 | 19,020 | -10,837 | -33,401 | -19,336 | -6,965 | -13,263 | -15,789 | -6,298 | 30,028 | 33,458 |
| 2003 | 66,838 | 55,201 | 7,692 | -11,766 | -28,994 | -33,846 | -22,675 | -20,684 | -41,817 | -30,343 | 4,564 | 34,778 |
| 2004 | 51,545 | 57,385 | -5,125 | -12,252 | -20,403 | -25,583 | -32,851 | -28,275 | -17,769 | -29,948 | -1,037 | 56,792 |
| 2005 | 49,223 | 32,145 | 18,812 | -19,384 | -25,754 | -16,898 | -2,184 | -4,624 | 2,566 | -8,876 | -18,817 | 31,674 |
| 2006 | 4,612 | 25,173 | -1,386 | -22,800 | -22,212 | -24,217 | -9,716 | -3,932 | -29,560 | -13,278 | 8,106 | 15,316 |
| 2007 | 41,537 | 59,809 | -9,318 | -3,622 | -29,300 | -22,304 | -21,140 | 7,796 | -18,266 | -24,418 | 6,085 | 26,066 |
| 2008 | 63,091 | 31,445 | 9,280 | -7,493 | -18,537 | -16,344 | -16,245 | -17,426 | 11,064 | -32,901 | -9,023 | 9,013 |
| 2009 | 45,921 | 21,105 | -14,679 | -22,525 | -43,605 | -12,959 | -20,997 | -13,755 | -24,392 | -8,812 | -4,366 | 52,537 |
| 2010 | 65,961 | 54,368 | -6,597 | -24,989 | -20,848 | -21,989 | -14,642 | -8,415 | -33,742 | -48,025 | -13,802 | 33,759 |
| 2011 | 53,081 | 51,330 | -14,984 | -15,554 | -27,712 | -4,612 | 11,081 | 3,402 | -25,780 | -55,944 | -16,673 | 5,241 |
| 2012 | 28,355 | 32,834 | -26,586 | 1,890 | -7,979 | -11,491 | 3,667 | -248 | -21,203 | -12,207 | 11,294 | 14,495 |
| 2013 | 42,515 | 50,019 | 44,253 | -13,738 | -24,998 | -30,652 | -32,014 | -19,228 | -27,100 | -26,671 | 15,308 | 36,550 |
| 2014 | 117,479 | 64,290 | 47,174 | -16,457 | -29,849 | -30,151 | -35,789 | -26,081 | -37,896 | -49,804 | 7,202 | 11,447 |
| 2015 | 57,369 | 73,436 | -1,990 | -45,037 | -36,612 | -16,431 | -17,892 | -20,717 | -33,722 | -40,257 | -15,244 | 8,860 |
| 2016 | 56,058 | 21,175 | -14,011 | -20,296 | -11,540 | -2,585 | 16,049 | 18,506 | -11,031 | -51,370 | -3,970 | 42,587 |
| 2017 | 22,579 | 11,892 | 22,982 | -22,014 | -19,393 | -5,251 | 1,075 | 3,696 | -23,167 | -13,491 | -10,494 | 57,784 |
| 2018 | 95,750 | 16,429 | 7,193 | 7,969 | -42,625 | -17,984 | 7,158 | -4,409 | -20,246 | -24,437 | 22,799 | 10,719 |
| 2019 | 60,935 | 50,759 | 17,530 | -56,512 | -42,654 | -39,117 | -18,409 | -10,645 | -37,776 | -44,922 | 3,691 | 19,539 |
| 2020 | 49,883 | 52,915 | -26,675 | -50,797 | -33,607 | -23,311 | 5,790 | -15,845 | -21,814 | 5,951 | -9,396 | 43,071 |
| 2021 | 61,714 | 90,715 | -25,836 | -16,290 | -33,878 | -3,457 | 15,400 | 10,733 | -27,866 | -42,567 | 12,490 | 7,715 |
| 2022 | 103,968 | 69,040 | -9,625 | -54,036 | -38,230 | -18,485 | 12,496 | 5,161 | -21,002 | -50,665 | -13,211 | 43,710 |
| 2023 | 11,630 | 17,546 | 2,255 | -8,275 | -30,838 | -14,060 | 10,465 | 21,907 | -16,912 | -37,579 | -14,049 | 7,844 |
| 2024 | 82,545 | -14,817 | -18,506 | -19,052 | -17,744 | -8,405 | 1,247 | 14,343 | -10,577 | -38,082 | -11,626 | 19,548 |
| 2025 | 109,427 | 67,179 | -35,040 | -37,557 | -48,632 | -23,584 | -3,317 | -2,261 | -2,034 | -33,355 | -14,594 | 22,037 |
| 2026 | 102,643 | 65,896 | -20,578 | -31,426 | ||||||||
| - = No Data Reported; -- = Not Applicable; NA = Not Available; W = Withheld to avoid disclosure of individual company data. |
| Release Date: 6/30/2026 |
| Next Release Date: 7/31/2026 |