|
Download Data (XLS File) |
|
||||||||
|
||||||||
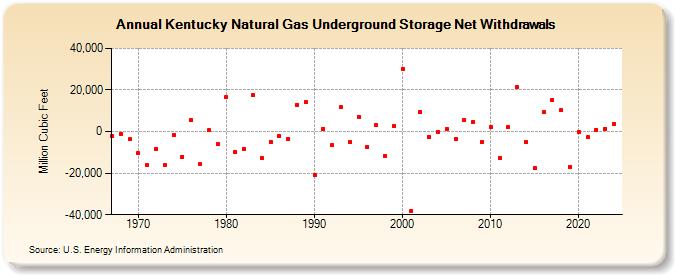
| Kentucky Natural Gas Underground Storage Net Withdrawals (Million Cubic Feet) | ||||||||
| Decade | Year-0 | Year-1 | Year-2 | Year-3 | Year-4 | Year-5 | Year-6 | Year-7 | Year-8 | Year-9 |
|---|---|---|---|---|---|---|---|---|---|---|
| 1960's | -2,236 | -944 | -3,760 | |||||||
| 1970's | -10,376 | -16,220 | -8,299 | -16,245 | -1,856 | -12,038 | 5,520 | -15,840 | 537 | -5,834 |
| 1980's | 16,547 | -9,915 | -8,178 | 17,543 | -12,841 | -4,895 | -2,278 | -3,608 | 12,902 | 14,147 |
| 1990's | -21,117 | 1,397 | -6,573 | 11,625 | -4,845 | 7,178 | -7,530 | 3,013 | -11,700 | 2,725 |
| 2000's | 30,198 | -38,209 | 9,445 | -2,547 | -179 | 1,274 | -3,610 | 5,440 | 4,694 | -4,938 |
| 2010's | 2,159 | -12,704 | 1,982 | 21,264 | -5,015 | -17,554 | 9,205 | 15,130 | 10,209 | -16,890 |
| 2020's | -143 | -2,785 | 909 | 1,440 | 3,811 | -2,377 |
| - = No Data Reported; -- = Not Applicable; NA = Not Available; W = Withheld to avoid disclosure of individual company data. |
| Release Date: 6/30/2026 |
| Next Release Date: 7/31/2026 |