|
Download Data (XLS File) |
|
||||||||
|
||||||||
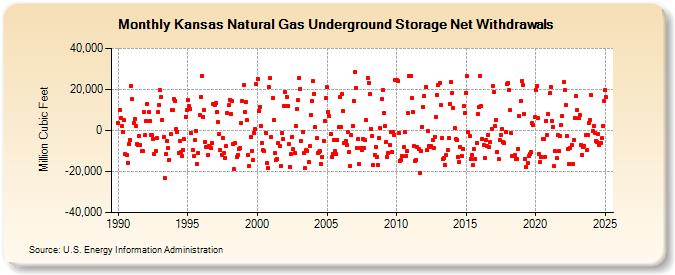
| Kansas Natural Gas Underground Storage Net Withdrawals (Million Cubic Feet) | ||||||||
| Year | Jan | Feb | Mar | Apr | May | Jun | Jul | Aug | Sep | Oct | Nov | Dec |
|---|---|---|---|---|---|---|---|---|---|---|---|---|
| 1990 | 3,632 | 10,174 | 5,905 | 2,064 | -587 | 5,106 | -11,583 | -12,116 | -15,641 | -6,679 | -4,510 | 21,682 |
| 1991 | 15,396 | 3,617 | 5,383 | 1,973 | -6,552 | -7,261 | -2,559 | -6,977 | -10,203 | -10,235 | 8,913 | -2,317 |
| 1992 | 4,420 | 13,082 | 9,031 | 4,821 | -2,161 | -2,319 | -4,255 | -11,527 | -10,142 | -3,672 | 9,027 | 12,181 |
| 1993 | 19,567 | 16,242 | 5,193 | -3,008 | -23,351 | -11,578 | -5,301 | -8,480 | -14,148 | -1,815 | 10,116 | 9,754 |
| 1994 | 15,338 | 14,179 | 835 | -523 | -10,760 | -5,194 | -10,613 | -12,337 | -9,624 | -4,370 | 6,723 | 10,129 |
| 1995 | 14,666 | 11,757 | 10,522 | -1,386 | -9,576 | -12,637 | -4,798 | -166 | -16,412 | -10,864 | 7,352 | 16,419 |
| 1996 | 26,627 | 6,590 | 9,984 | -5,779 | -7,892 | -12,192 | -7,537 | -8,265 | -8,532 | -6,005 | 12,828 | 12,290 |
| 1997 | 13,411 | 8,989 | 4,053 | -1,497 | -9,463 | -11,777 | -3,488 | -11,129 | -13,351 | -7,782 | 8,384 | 12,277 |
| 1998 | 14,910 | 8,141 | 14,242 | -6,791 | -18,906 | -6,032 | -12,830 | -11,957 | -9,036 | -8,545 | 3,580 | 14,533 |
| 1999 | 22,198 | 9,144 | 13,750 | 5,000 | -12,184 | -17,117 | -3,081 | -9,853 | -14,542 | -1,078 | 873 | 22,458 |
| 2000 | 25,275 | 9,582 | 11,536 | 2,341 | -6,168 | -9,640 | -9,926 | -1,042 | -16,047 | -18,438 | 20,998 | 25,577 |
| 2001 | -3,396 | 15,963 | 5,157 | -11,148 | -14,194 | -13,667 | -6,314 | -7,456 | -17,194 | -1,160 | -4,343 | 12,165 |
| 2002 | 18,633 | 16,522 | 12,094 | -6,641 | -17,560 | -11,533 | -3,170 | -9,239 | -11,013 | 2,040 | 10,367 | 14,652 |
| 2003 | 25,665 | 20,396 | -4,997 | -521 | -11,018 | -18,311 | -9,728 | -9,840 | -15,287 | -7,672 | 7,406 | 14,208 |
| 2004 | 23,982 | 17,998 | 1,473 | -3,901 | -11,107 | -10,639 | -9,852 | -16,096 | -12,964 | -4,958 | 4,801 | 15,747 |
| 2005 | 21,163 | 8,825 | 6,956 | -1,813 | -12,828 | -11,630 | -4,654 | -10,074 | -11,475 | -4,438 | 1,574 | 16,358 |
| 2006 | 1,868 | 17,855 | 9,402 | -6,224 | -5,011 | -7,128 | -871 | -10,351 | -17,305 | -2,338 | 2,375 | 14,320 |
| 2007 | 28,613 | 20,599 | -8,512 | -4,103 | -16,423 | -8,465 | -9,440 | -4,128 | -8,519 | -4,798 | 4,934 | 25,597 |
| 2008 | 23,025 | 17,748 | 867 | -2,726 | -16,937 | -11,754 | -7,969 | -12,807 | -16,730 | -3,619 | 1,006 | 15,282 |
| 2009 | 19,495 | 8,388 | 2,087 | -5,515 | -13,107 | -10,973 | -7,153 | -965 | -10,413 | -728 | -2,046 | 24,615 |
| 2010 | 24,540 | 24,035 | -1,298 | -14,917 | -14,450 | -12,656 | -8,241 | -901 | -12,252 | -10,207 | 8,297 | 26,534 |
| 2011 | 26,553 | 15,707 | 9,055 | -7,707 | -14,658 | -14,311 | -7,995 | -9,252 | -20,715 | -10,057 | 1,733 | 11,351 |
| 2012 | 16,650 | 21,204 | -9,691 | -189 | -7,394 | -8,258 | -7,709 | -4,837 | -8,561 | -3,176 | 6,354 | 17,523 |
| 2013 | 22,400 | 23,344 | 12,194 | -3,587 | -14,000 | -13,321 | -16,791 | -11,896 | -9,662 | -3,833 | 13,114 | 23,455 |
| 2014 | 18,383 | 11,044 | 1,135 | -3,998 | -4,659 | -12,785 | -15,372 | -7,892 | -12,602 | -9,250 | 11,740 | 8,640 |
| 2015 | 18,461 | 26,416 | -721 | -2,777 | -13,935 | -11,868 | -16,737 | -9,249 | -14,045 | -5,912 | 7,836 | 11,377 |
| 2016 | 26,541 | 11,913 | -4,070 | -7,171 | -13,272 | -4,701 | -7,378 | -2,098 | -8,157 | -5,573 | 876 | 21,467 |
| 2017 | 18,823 | 2,192 | 5,246 | -10,252 | -14,016 | -4,611 | -2,088 | 656 | -5,422 | -5,986 | -872 | 22,474 |
| 2018 | 23,304 | 19,645 | 9,818 | -1,471 | -12,254 | -12,300 | -12,141 | -13,675 | -13,872 | -8,986 | 6,918 | 14,219 |
| 2019 | 24,030 | 22,056 | 7,971 | -13,773 | -17,835 | -15,807 | -12,415 | -11,621 | -10,591 | 3,567 | 2,754 | 6,480 |
| 2020 | 19,934 | 21,799 | 6,016 | -11,701 | -15,574 | -12,961 | -4,248 | -4,208 | -12,894 | 4,761 | -2,237 | 8,039 |
| 2021 | 18,141 | 21,201 | 4,590 | 1,680 | -17,547 | -10,225 | -13,368 | -2,250 | -10,136 | -2,772 | 2,469 | 7,289 |
| 2022 | 23,723 | 19,617 | 12,483 | -2,851 | -8,999 | -16,307 | -8,414 | -6,891 | -16,415 | -4,401 | 5,969 | 16,854 |
| 2023 | 9,956 | 5,876 | 7,709 | -6,853 | -11,800 | -7,987 | -7,498 | -2,357 | -9,754 | -2,291 | 3,751 | 5,068 |
| 2024 | 17,261 | -243 | 2,292 | -1,072 | -4,999 | -5,754 | -1,626 | -6,856 | -5,975 | -3,854 | 2,416 | 14,287 |
| 2025 | 19,882 | 16,152 | 2,469 | 381 | -9,949 | -14,767 | -9,123 | -5,447 | -14,431 | -1,629 | 3,605 | 10,312 |
| 2026 | 24,322 | 7,274 | 3,411 | 78 | ||||||||
| - = No Data Reported; -- = Not Applicable; NA = Not Available; W = Withheld to avoid disclosure of individual company data. |
| Release Date: 6/30/2026 |
| Next Release Date: 7/31/2026 |