|
Download Data (XLS File) |
|
||||||||
|
||||||||
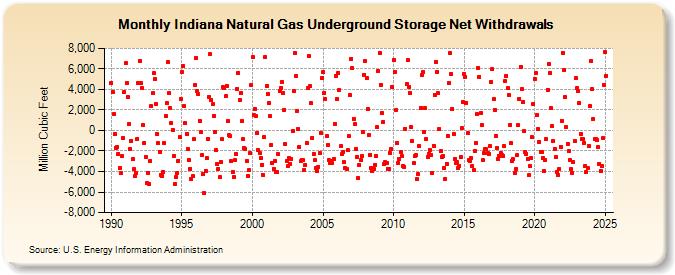
| Indiana Natural Gas Underground Storage Net Withdrawals (Million Cubic Feet) | ||||||||
| Year | Jan | Feb | Mar | Apr | May | Jun | Jul | Aug | Sep | Oct | Nov | Dec |
|---|---|---|---|---|---|---|---|---|---|---|---|---|
| 1990 | 4,651 | 3,709 | 1,605 | -345 | -1,751 | -1,651 | -2,257 | -3,691 | -4,174 | -2,532 | -744 | 3,768 |
| 1991 | 6,551 | 4,615 | 3,305 | 598 | -1,770 | -1,016 | -2,813 | -3,797 | -4,467 | -4,105 | -802 | 4,626 |
| 1992 | 6,794 | 4,606 | 4,104 | 500 | -1,206 | -2,563 | -5,123 | -4,107 | -5,203 | -2,936 | 2,364 | 3,610 |
| 1993 | 5,575 | 5,021 | 2,557 | -390 | -1,247 | -2,094 | -4,346 | -4,412 | -4,057 | -1,255 | 1,389 | 2,662 |
| 1994 | 6,645 | 3,618 | 2,184 | 733 | 65 | -2,451 | -5,189 | -4,529 | -4,141 | -2,947 | -648 | 3,083 |
| 1995 | 5,699 | 6,305 | 2,374 | 682 | -310 | -1,793 | -2,861 | -3,727 | -4,766 | -4,448 | -844 | 4,401 |
| 1996 | 7,073 | 3,804 | 3,532 | 948 | -178 | -2,398 | -4,278 | -6,115 | -3,911 | -2,715 | -853 | 3,290 |
| 1997 | 7,425 | 2,954 | 2,537 | 1,444 | -110 | -1,913 | -3,299 | -3,722 | -4,559 | -3,088 | -879 | 4,193 |
| 1998 | 4,158 | 3,335 | 4,371 | 929 | -483 | -519 | -2,987 | -4,058 | -4,532 | -2,901 | -2,296 | 4,063 |
| 1999 | 5,608 | 2,958 | 3,698 | 915 | -839 | -1,755 | -1,815 | -2,939 | -4,404 | -3,862 | -2,227 | 4,419 |
| 2000 | 7,120 | 1,482 | 2,071 | 1,377 | -248 | -1,910 | -2,195 | -2,698 | -3,323 | -4,297 | -608 | 7,120 |
| 2001 | 4,340 | 3,602 | 2,669 | 1,382 | -1,382 | -3,189 | -3,719 | -2,954 | -4,087 | -4,094 | -2,310 | 3,832 |
| 2002 | 4,142 | 4,735 | 3,653 | 2,042 | -1,356 | -2,946 | -3,475 | -2,706 | -3,255 | -2,803 | -46 | 3,853 |
| 2003 | 7,519 | 5,301 | 1,946 | 158 | -1,609 | -3,017 | -2,862 | -2,907 | -3,822 | -3,346 | -1,204 | 4,104 |
| 2004 | 7,218 | 4,297 | 2,637 | -698 | -2,258 | -2,925 | -3,697 | -3,944 | -3,542 | -2,159 | -204 | 5,077 |
| 2005 | 5,709 | 3,677 | 3,116 | -545 | -1,424 | -2,920 | -3,206 | -2,958 | -3,215 | -2,805 | 647 | 5,343 |
| 2006 | 3,061 | 5,632 | 3,989 | -1,548 | -2,326 | -2,115 | -3,111 | -3,642 | -3,740 | -1,950 | -554 | 3,414 |
| 2007 | 7,011 | 6,079 | 1,161 | 605 | -1,783 | -2,556 | -4,609 | -3,352 | -2,916 | -2,529 | -129 | 5,437 |
| 2008 | 6,742 | 5,101 | 2,094 | -450 | -2,356 | -3,644 | -3,970 | -3,743 | -3,341 | -2,488 | 292 | 5,799 |
| 2009 | 7,593 | 4,468 | 1,712 | 826 | -3,264 | -3,118 | -3,187 | -3,722 | -3,725 | -2,199 | -1,787 | 4,221 |
| 2010 | 6,898 | 5,708 | 1,990 | -1,226 | -3,124 | -2,815 | -2,132 | -2,465 | -3,437 | -3,557 | 170 | 4,501 |
| 2011 | 6,855 | 4,278 | 3,641 | 314 | -1,049 | -3,186 | -2,488 | -2,403 | -4,763 | -4,273 | -1,541 | 2,214 |
| 2012 | 5,434 | 5,652 | -131 | 2,149 | -824 | -2,557 | -2,263 | -1,922 | -2,353 | -4,115 | -1,468 | 3,495 |
| 2013 | 6,698 | 5,719 | 3,611 | 162 | -2,022 | -2,580 | -2,503 | -3,675 | -4,703 | -3,236 | -517 | 4,638 |
| 2014 | 7,553 | 5,517 | 2,106 | -297 | -2,745 | -3,175 | -3,103 | -3,655 | -3,451 | -2,561 | 207 | 2,764 |
| 2015 | 5,552 | 5,238 | 2,709 | -294 | -2,903 | -2,942 | -2,687 | -3,494 | -3,878 | -2,047 | -1,236 | 1,569 |
| 2016 | 6,106 | 5,259 | 1,694 | 527 | -2,905 | -2,226 | -1,850 | -1,850 | -2,199 | -2,257 | -1,533 | 4,712 |
| 2017 | 5,972 | 3,067 | 2,040 | -501 | -1,664 | -2,782 | -2,486 | -2,191 | -2,352 | -2,472 | -1,525 | 4,827 |
| 2018 | 5,357 | 4,115 | 3,497 | 542 | -1,240 | -3,023 | -2,826 | -4,155 | -3,720 | -2,417 | 497 | 3,094 |
| 2019 | 6,207 | 3,994 | 2,798 | -99 | -2,093 | -2,270 | -2,746 | -4,377 | -3,454 | -2,665 | -674 | 2,562 |
| 2020 | 5,021 | 5,572 | 1,494 | 97 | -1,146 | -2,056 | -2,071 | -2,695 | -3,960 | -2,910 | -832 | 3,993 |
| 2021 | 6,498 | 5,629 | 2,162 | 409 | -1,052 | -1,784 | -2,610 | -4,004 | -4,359 | -3,748 | -1,584 | 972 |
| 2022 | 7,596 | 5,855 | 3,220 | 310 | -1,275 | -2,048 | -2,836 | -3,784 | -4,135 | -3,115 | -1,026 | 5,101 |
| 2023 | 4,108 | 3,799 | 2,668 | -359 | -824 | -802 | -1,226 | -3,454 | -4,074 | -3,644 | -1,513 | 2,374 |
| 2024 | 6,755 | 4,021 | 1,113 | -855 | -803 | -962 | -1,608 | -3,234 | -3,966 | -3,492 | -774 | 4,432 |
| 2025 | 7,659 | 5,337 | 1,733 | -487 | -2,062 | -2,076 | -2,484 | -3,973 | -4,328 | -3,075 | -495 | 3,996 |
| 2026 | 6,771 | 4,307 | 1,498 | -373 | ||||||||
| - = No Data Reported; -- = Not Applicable; NA = Not Available; W = Withheld to avoid disclosure of individual company data. |
| Release Date: 6/30/2026 |
| Next Release Date: 7/31/2026 |