|
Download Data (XLS File) |
|
||||||||
|
||||||||
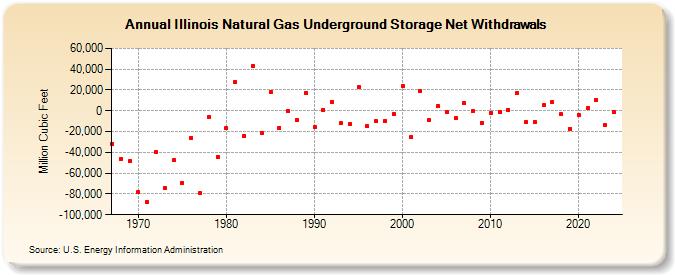
| Illinois Natural Gas Underground Storage Net Withdrawals (Million Cubic Feet) | ||||||||
| Decade | Year-0 | Year-1 | Year-2 | Year-3 | Year-4 | Year-5 | Year-6 | Year-7 | Year-8 | Year-9 |
|---|---|---|---|---|---|---|---|---|---|---|
| 1960's | -31,495 | -46,034 | -48,160 | |||||||
| 1970's | -78,193 | -87,592 | -39,910 | -74,522 | -47,744 | -69,306 | -25,844 | -78,904 | -6,479 | -44,008 |
| 1980's | -16,621 | 27,678 | -24,056 | 43,126 | -21,022 | 17,962 | -16,244 | -177 | -8,759 | 17,378 |
| 1990's | -15,926 | 978 | 8,608 | -12,196 | -12,907 | 22,981 | -15,109 | -10,153 | -9,780 | -2,715 |
| 2000's | 24,165 | -25,587 | 19,029 | -8,899 | 4,602 | -1,226 | -7,163 | 7,333 | -506 | -11,464 |
| 2010's | -2,323 | -1,186 | 1,001 | 17,324 | -10,730 | -10,603 | 5,282 | 8,410 | -3,407 | -17,252 |
| 2020's | -3,947 | 2,361 | 10,416 | -13,992 | -1,144 | 3,426 |
| - = No Data Reported; -- = Not Applicable; NA = Not Available; W = Withheld to avoid disclosure of individual company data. |
| Release Date: 6/30/2026 |
| Next Release Date: 7/31/2026 |