|
Download Data (XLS File) |
|
||||||||
|
||||||||
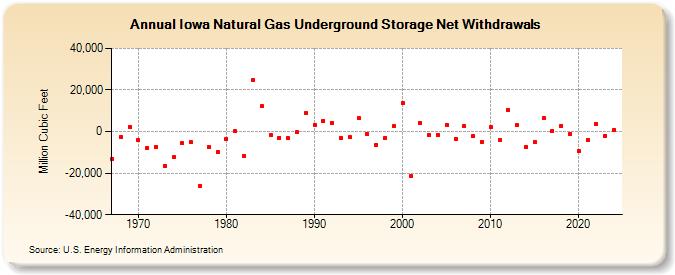
| Iowa Natural Gas Underground Storage Net Withdrawals (Million Cubic Feet) | ||||||||
| Decade | Year-0 | Year-1 | Year-2 | Year-3 | Year-4 | Year-5 | Year-6 | Year-7 | Year-8 | Year-9 |
|---|---|---|---|---|---|---|---|---|---|---|
| 1960's | -13,122 | -2,508 | 2,306 | |||||||
| 1970's | -4,233 | -7,786 | -7,279 | -16,659 | -12,391 | -5,661 | -5,256 | -26,037 | -7,516 | -9,716 |
| 1980's | -3,464 | 53 | -11,934 | 24,768 | 12,148 | -1,876 | -2,951 | -3,272 | -417 | 9,035 |
| 1990's | 3,299 | 5,207 | 4,259 | -3,176 | -2,764 | 6,443 | -1,229 | -6,255 | -2,954 | 2,445 |
| 2000's | 13,560 | -21,435 | 4,251 | -1,774 | -1,667 | 3,379 | -3,563 | 2,450 | -2,274 | -4,861 |
| 2010's | 2,037 | -4,244 | 10,517 | 3,074 | -7,424 | -4,955 | 6,414 | 329 | 2,874 | -1,067 |
| 2020's | -9,470 | -3,940 | 3,696 | -1,961 | 794 | 221 |
| - = No Data Reported; -- = Not Applicable; NA = Not Available; W = Withheld to avoid disclosure of individual company data. |
| Release Date: 6/30/2026 |
| Next Release Date: 7/31/2026 |