|
Download Data (XLS File) |
|
||||||||
|
||||||||
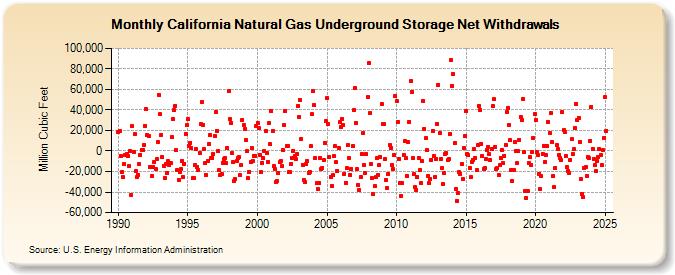
| California Natural Gas Underground Storage Net Withdrawals (Million Cubic Feet) | ||||||||
| Year | Jan | Feb | Mar | Apr | May | Jun | Jul | Aug | Sep | Oct | Nov | Dec |
|---|---|---|---|---|---|---|---|---|---|---|---|---|
| 1990 | 18,621 | 19,323 | -4,673 | -20,954 | -25,367 | -13,120 | -4,261 | -2,802 | -4,538 | -14,390 | 299 | -42,541 |
| 1991 | 24,004 | -498 | 16,578 | -19,948 | -25,622 | -23,367 | -13,136 | -3,416 | 1,455 | 879 | 6,113 | 24,681 |
| 1992 | 40,831 | 15,305 | 14,214 | -15,220 | -15,170 | -23,985 | -15,281 | -10,887 | -17,264 | -8,186 | 9,135 | 54,629 |
| 1993 | 35,741 | 16,046 | -6,099 | -14,332 | -26,027 | -13,004 | -21,057 | -9,857 | -13,719 | -11,815 | 13,528 | 30,903 |
| 1994 | 39,516 | 44,297 | 894 | -18,961 | -28,160 | -20,300 | -17,672 | -9,372 | -25,551 | -12,273 | 16,783 | 25,734 |
| 1995 | 30,994 | 4,882 | 8,053 | 2,818 | -26,521 | -26,115 | -13,534 | 1,565 | -15,258 | -18,197 | -1,980 | 25,933 |
| 1996 | 47,924 | 25,693 | 1,459 | -11,917 | -23,523 | -9,697 | 7,028 | 15,439 | -6,822 | -6,393 | -2,885 | 14,985 |
| 1997 | 38,462 | 19,814 | -289 | -18,968 | -23,687 | -22,886 | -11,213 | -7,805 | -6,637 | -11,717 | 2,846 | 58,418 |
| 1998 | 30,733 | 27,350 | -2,021 | -10,607 | -29,142 | -27,432 | -9,351 | -7,171 | -5,931 | -23,861 | -14,022 | 30,486 |
| 1999 | 25,038 | 21,751 | 10,391 | -255 | -26,494 | -20,225 | -10,930 | 3,398 | -9,527 | -4,598 | -4,553 | 24,198 |
| 2000 | 27,434 | 21,967 | -3,491 | -20,587 | -11,320 | -7,106 | 199 | 19,420 | -1,623 | -10,735 | 27,309 | 6,493 |
| 2001 | 38,747 | 19,843 | -15,032 | -17,513 | -29,927 | -29,695 | -21,278 | -11,195 | -9,559 | -14,716 | 616 | 25,035 |
| 2002 | 39,393 | 4,939 | 5,245 | -20,680 | -20,695 | -12,551 | -7,074 | 291 | -4,707 | -8,108 | -3,132 | 44,101 |
| 2003 | 33,248 | 49,464 | 12,130 | -13,402 | -27,859 | -30,296 | -12,996 | -9,889 | -21,318 | -20,167 | 4,514 | 35,860 |
| 2004 | 58,454 | 44,678 | -6,835 | -31,643 | -37,160 | -31,026 | -6,570 | -17,575 | -16,145 | -9,110 | 7,840 | 28,759 |
| 2005 | 51,493 | 25,863 | -5,626 | -25,297 | -33,771 | -23,730 | -4,702 | 4,621 | -11,127 | -19,332 | 2,747 | 28,163 |
| 2006 | 23,340 | 31,412 | 25,267 | -22,010 | -30,788 | -16,715 | 5,729 | -7,288 | -23,147 | -17,357 | 5,074 | 39,774 |
| 2007 | 61,296 | 27,551 | -18,028 | -32,953 | -38,189 | -25,205 | -2,609 | 17,581 | -13,600 | -21,651 | -3,107 | 52,598 |
| 2008 | 85,676 | 37,025 | -12,541 | -26,643 | -42,290 | -34,526 | -25,600 | -6,874 | -23,074 | -13,840 | -5,908 | 45,873 |
| 2009 | 26,049 | 26,123 | -8,021 | -27,821 | -35,873 | -22,034 | 6,042 | 3,211 | -14,127 | -17,758 | -3,949 | 53,592 |
| 2010 | 48,289 | 28,429 | -7,440 | -30,726 | -43,478 | -31,005 | -3,546 | 9,738 | -6,753 | -23,951 | 8,753 | 28,531 |
| 2011 | 67,910 | 57,788 | -7,099 | -22,717 | -35,565 | -37,842 | -25,328 | -6,488 | -18,746 | -31,066 | -9,962 | 48,526 |
| 2012 | 21,511 | 12,327 | 853 | -24,477 | -31,599 | -26,979 | -8,385 | 19,911 | -4,969 | -25,699 | -7,369 | 26,798 |
| 2013 | 64,541 | 17,771 | -7,757 | -16,646 | -32,304 | -21,691 | -3,173 | -2,117 | -9,247 | -8,194 | 17,045 | 88,275 |
| 2014 | 63,722 | 74,988 | 7,619 | -37,379 | -48,253 | -41,166 | -20,946 | -22,052 | -12,319 | -27,183 | 2,894 | 14,741 |
| 2015 | 38,916 | -2,750 | -4,345 | -16,467 | -25,451 | -10,336 | -8,522 | 1,758 | -6,577 | -18,709 | 5,699 | 44,087 |
| 2016 | 40,217 | 7,203 | -4,805 | -17,261 | -16,700 | -7,766 | 769 | 4,248 | -3,383 | -8,590 | 1,937 | 43,736 |
| 2017 | 50,395 | 4,300 | -17,258 | -16,167 | -23,446 | -13,935 | -6,826 | 1,123 | -12,170 | -4,453 | 6,223 | 37,901 |
| 2018 | 41,978 | 25,368 | 10,696 | -18,639 | -29,083 | -18,473 | 8,376 | 290 | -12,150 | -365 | 11,111 | 33,067 |
| 2019 | 30,628 | 50,783 | -1,442 | -39,081 | -45,527 | -39,458 | -11,473 | -6,262 | -13,476 | -1,316 | 12,544 | 35,944 |
| 2020 | 30,582 | -1,238 | -3,906 | -22,091 | -37,280 | -24,699 | -2,993 | 5,352 | -10,674 | -4,004 | 4,522 | 28,116 |
| 2021 | 17,158 | 36,861 | 8,459 | -24,435 | -35,332 | -16,786 | 5,393 | 1,571 | -3,475 | -6,558 | -8,547 | 37,575 |
| 2022 | 20,438 | 18,689 | -4,812 | -15,824 | -19,244 | -21,321 | -8,374 | 11,338 | -2,702 | 1,537 | 22,453 | 46,261 |
| 2023 | 29,781 | 32,422 | 8,985 | -27,136 | -41,501 | -45,318 | -16,579 | -16,003 | -24,345 | -6,131 | -7,093 | 9,751 |
| 2024 | 43,248 | 1,951 | -7,580 | -13,653 | -19,768 | -9,595 | -5,447 | 2,183 | -4,083 | -13,677 | 488 | 12,776 |
| 2025 | 52,317 | 19,971 | -4,505 | -20,451 | -24,182 | -20,075 | -13,736 | 8,201 | -5,088 | -14,435 | 5,980 | 6,936 |
| 2026 | 23,045 | 7,969 | -1,316 | -13,124 | ||||||||
| - = No Data Reported; -- = Not Applicable; NA = Not Available; W = Withheld to avoid disclosure of individual company data. |
| Release Date: 6/30/2026 |
| Next Release Date: 7/31/2026 |