|
Download Data (XLS File) |
|
||||||||
|
||||||||
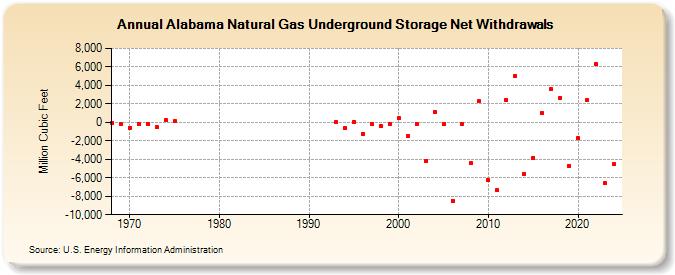
| Alabama Natural Gas Underground Storage Net Withdrawals (Million Cubic Feet) | ||||||||
| Decade | Year-0 | Year-1 | Year-2 | Year-3 | Year-4 | Year-5 | Year-6 | Year-7 | Year-8 | Year-9 |
|---|---|---|---|---|---|---|---|---|---|---|
| 1960's | -27 | -142 | ||||||||
| 1970's | -566 | -183 | -129 | -554 | 211 | 98 | ||||
| 1990's | 0 | -639 | 73 | -1,224 | -162 | -447 | -164 | |||
| 2000's | 430 | -1,499 | -154 | -4,165 | 1,133 | -216 | -8,477 | -140 | -4,452 | 2,278 |
| 2010's | -6,286 | -7,357 | 2,456 | 5,002 | -5,603 | -3,817 | 1,019 | 3,570 | 2,660 | -4,680 |
| 2020's | -1,740 | 2,456 | 6,278 | -6,555 | -4,540 | 1,683 |
| - = No Data Reported; -- = Not Applicable; NA = Not Available; W = Withheld to avoid disclosure of individual company data. |
| Release Date: 6/30/2026 |
| Next Release Date: 7/31/2026 |