|
Download Data (XLS File) |
|
||||||||
|
||||||||
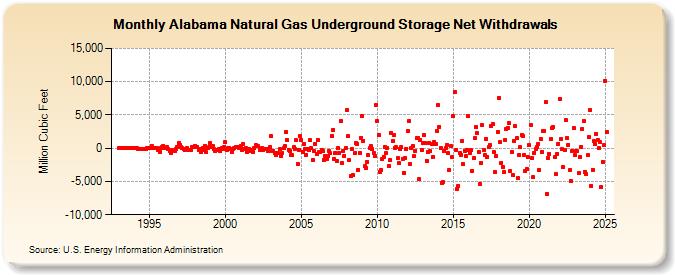
| Alabama Natural Gas Underground Storage Net Withdrawals (Million Cubic Feet) | ||||||||
| Year | Jan | Feb | Mar | Apr | May | Jun | Jul | Aug | Sep | Oct | Nov | Dec |
|---|---|---|---|---|---|---|---|---|---|---|---|---|
| 1993 | 0 | 0 | 0 | 0 | 0 | 0 | 0 | 0 | 0 | 0 | 0 | 0 |
| 1994 | 9 | 0 | -21 | -70 | -106 | -95 | -102 | -92 | -85 | -54 | -20 | -4 |
| 1995 | 60 | 2 | 264 | 0 | -27 | -42 | -35 | -218 | -592 | 73 | 189 | 400 |
| 1996 | 54 | 17 | 162 | -153 | -367 | -670 | -205 | -395 | -440 | -117 | 129 | 761 |
| 1997 | 531 | 184 | -25 | -130 | -271 | -93 | -43 | -286 | -262 | -251 | 243 | 243 |
| 1998 | 396 | 187 | 248 | -245 | -144 | -623 | 9 | -200 | 401 | -613 | -1 | 139 |
| 1999 | 813 | 114 | 312 | -137 | -471 | -210 | -235 | -81 | -402 | 77 | -134 | 189 |
| 2000 | 916 | -307 | -8 | 66 | -90 | -606 | -82 | 0 | 110 | 142 | 203 | 85 |
| 2001 | 330 | -241 | 604 | -195 | 44 | -576 | -154 | -113 | -366 | -293 | -522 | -14 |
| 2002 | 412 | 314 | 270 | -258 | -100 | 2 | -250 | -97 | -64 | -128 | -397 | 141 |
| 2003 | 1,789 | -420 | -456 | -797 | -990 | -742 | -779 | -144 | -1,240 | -728 | 20 | 323 |
| 2004 | 2,417 | 1,180 | -229 | -477 | -1,087 | -1,092 | 134 | -111 | 1,183 | -2,350 | -211 | 1,776 |
| 2005 | 1,202 | -519 | 668 | -66 | -957 | -60 | -278 | 1,183 | -20 | -1,709 | -354 | 694 |
| 2006 | -909 | 1,252 | -607 | -617 | -198 | -422 | -1,773 | -1,202 | -1,638 | -1,186 | -406 | -770 |
| 2007 | 1,854 | 2,785 | -1,604 | -708 | -1,929 | -28 | -717 | 4,047 | -2,199 | -458 | -1,184 | 0 |
| 2008 | 5,681 | 1,783 | -1,842 | -4,228 | -107 | -4,056 | -764 | 715 | 692 | -3,208 | -700 | 1,582 |
| 2009 | 4,848 | 1,154 | -2,689 | -2,929 | -2,017 | -1,045 | 65 | 265 | -130 | -683 | -1,111 | 6,549 |
| 2010 | 4,068 | 1,958 | -3,562 | -3,209 | -1,658 | -1,254 | 174 | -697 | 46 | -2,672 | -1,789 | 2,308 |
| 2011 | 1,047 | 1,938 | 88 | 116 | -1,515 | -2,282 | -77 | 141 | -1,575 | -3,673 | -1,517 | -48 |
| 2012 | 2,525 | 4,062 | -2,342 | -11 | 364 | -1,215 | -381 | 1,504 | 1,593 | -4,696 | 1,262 | -209 |
| 2013 | 821 | 1,923 | 773 | -1,880 | -504 | 798 | -497 | 639 | -1,294 | 928 | 666 | 2,628 |
| 2014 | 6,448 | 3,236 | 61 | -5,260 | -5,110 | -420 | -38 | 492 | -761 | -3,227 | 321 | -1,346 |
| 2015 | 4,774 | 8,440 | -243 | -6,159 | -5,684 | -734 | -971 | 1,057 | -2,416 | -415 | -1,217 | -249 |
| 2016 | 4,787 | -713 | -323 | -3,383 | -1,536 | 1,486 | 3,115 | 2,250 | -597 | -5,368 | -2,161 | 3,462 |
| 2017 | -254 | -1,005 | 1,420 | -1,292 | 169 | 498 | 3,386 | 3,628 | -561 | -3,630 | -1,237 | 2,448 |
| 2018 | 7,522 | 885 | -2,192 | -2,801 | -3,590 | 1,165 | 2,879 | 3,070 | 3,736 | -3,424 | -553 | -4,038 |
| 2019 | 1,154 | 3,277 | 1,480 | -4,541 | -1,047 | 119 | 1,992 | 1,779 | -1,058 | -3,437 | -3,103 | -1,295 |
| 2020 | 437 | 3,469 | -1,483 | -4,401 | -669 | -112 | 185 | 656 | -3,260 | 1,436 | -528 | 2,532 |
| 2021 | 2,591 | 6,905 | -6,884 | -1,461 | -888 | 1,445 | 2,990 | 3,196 | -1,352 | -3,936 | -822 | 671 |
| 2022 | 7,356 | 1,367 | -134 | -2,894 | -242 | 4,241 | 1,553 | 526 | -3,282 | -4,933 | -377 | 3,098 |
| 2023 | -1,070 | -392 | -468 | -3,731 | -1,303 | 243 | 2,868 | 4,087 | -3,531 | -3,850 | -1,078 | 1,668 |
| 2024 | 5,760 | -5,618 | -3,240 | 1,061 | 640 | 2,198 | 1,238 | 22 | 884 | -5,851 | -2,037 | 406 |
| 2025 | 10,169 | 2,371 | -7,521 | -3,986 | -2,429 | 3,155 | 6,425 | -2,530 | -2,672 | -4,152 | -287 | 3,140 |
| 2026 | 9,952 | 2,215 | -5,568 | -5,559 | ||||||||
| - = No Data Reported; -- = Not Applicable; NA = Not Available; W = Withheld to avoid disclosure of individual company data. |
| Release Date: 6/30/2026 |
| Next Release Date: 7/31/2026 |