|
Download Data (XLS File) |
|
||||||||
|
||||||||
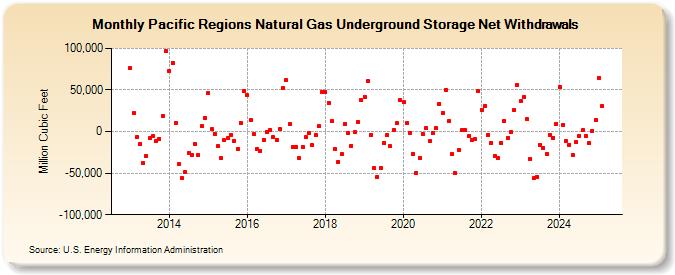
| Pacific Regions Natural Gas Underground Storage Net Withdrawals (Million Cubic Feet) | ||||||||
| Year | Jan | Feb | Mar | Apr | May | Jun | Jul | Aug | Sep | Oct | Nov | Dec |
|---|---|---|---|---|---|---|---|---|---|---|---|---|
| 2013 | 76,400 | 22,236 | -6,988 | -14,695 | -38,115 | -28,898 | -8,257 | -5,683 | -11,706 | -8,664 | 18,964 | 96,759 |
| 2014 | 72,695 | 82,912 | 10,393 | -39,504 | -56,302 | -48,717 | -25,531 | -28,027 | -15,268 | -27,912 | 6,464 | 16,684 |
| 2015 | 46,544 | 2,649 | -2,557 | -17,550 | -32,152 | -10,588 | -8,243 | -3,674 | -11,035 | -20,831 | 10,625 | 49,135 |
| 2016 | 43,542 | 13,538 | -3,232 | -21,206 | -23,319 | -10,112 | -906 | 2,142 | -6,916 | -9,785 | 2,790 | 52,233 |
| 2017 | 61,803 | 8,927 | -18,066 | -19,099 | -32,194 | -18,145 | -7,041 | -1,804 | -16,679 | -3,956 | 6,222 | 47,067 |
| 2018 | 48,067 | 34,834 | 12,640 | -21,156 | -36,288 | -26,969 | 9,052 | -1,727 | -16,903 | -1,037 | 12,049 | 37,856 |
| 2019 | 41,748 | 60,659 | -3,761 | -43,727 | -54,630 | -43,928 | -13,489 | -4,676 | -17,809 | 1,770 | 9,745 | 37,660 |
| 2020 | 35,021 | 10,835 | -1,383 | -26,656 | -49,243 | -31,330 | -3,220 | 4,210 | -11,821 | -1,335 | 3,840 | 33,696 |
| 2021 | 22,792 | 50,267 | 12,673 | -27,531 | -50,261 | -22,511 | 1,739 | 1,823 | -5,562 | -9,696 | -9,093 | 48,371 |
| 2022 | 26,400 | 30,765 | -3,575 | -13,178 | -29,912 | -32,284 | -13,390 | 12,794 | -7,295 | -318 | 26,170 | 56,214 |
| 2023 | 36,212 | 41,548 | 14,588 | -32,563 | -56,223 | -54,224 | -15,786 | -19,961 | -26,902 | -4,101 | -7,241 | 9,569 |
| 2024 | 53,364 | 8,033 | -11,286 | -15,746 | -27,776 | -12,295 | -5,021 | 1,400 | -5,642 | -14,032 | 1,094 | 14,067 |
| 2025 | 64,718 | 30,875 | -5,851 | -25,338 | -30,693 | -27,528 | -16,484 | 9,471 | -7,304 | -14,441 | 4,241 | 9,413 |
| 2026 | 31,990 | 14,205 | -1,638 | -15,145 | ||||||||
| - = No Data Reported; -- = Not Applicable; NA = Not Available; W = Withheld to avoid disclosure of individual company data. |
| Release Date: 6/30/2026 |
| Next Release Date: 7/31/2026 |