|
Download Data (XLS File) |
|
||||||||
|
||||||||
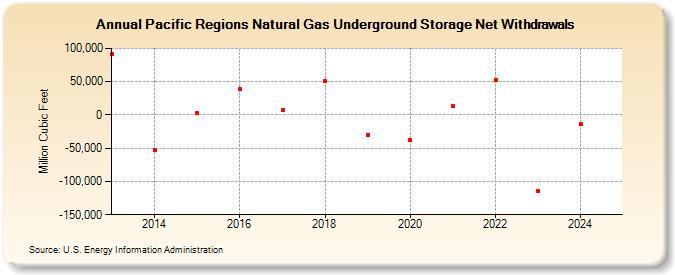
| Pacific Regions Natural Gas Underground Storage Net Withdrawals (Million Cubic Feet) | ||||||||
| Decade | Year-0 | Year-1 | Year-2 | Year-3 | Year-4 | Year-5 | Year-6 | Year-7 | Year-8 | Year-9 |
|---|---|---|---|---|---|---|---|---|---|---|
| 2010's | 91,352 | -52,112 | 2,322 | 38,769 | 7,035 | 50,417 | -30,438 | |||
| 2020's | -37,386 | 13,012 | 52,392 | -115,082 | -13,842 | -8,921 |
| - = No Data Reported; -- = Not Applicable; NA = Not Available; W = Withheld to avoid disclosure of individual company data. |
| Release Date: 6/30/2026 |
| Next Release Date: 7/31/2026 |