|
Download Data (XLS File) |
|
||||||||
|
||||||||
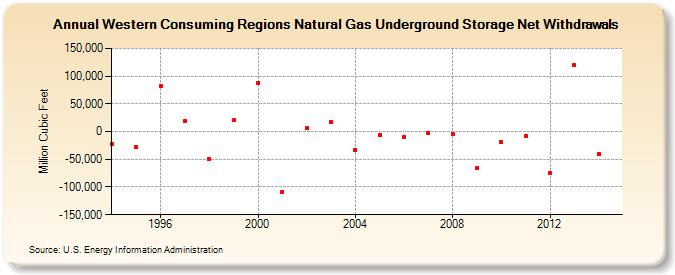
| Western Consuming Regions Natural Gas Underground Storage Net Withdrawals (Million Cubic Feet) | ||||||||
| Decade | Year-0 | Year-1 | Year-2 | Year-3 | Year-4 | Year-5 | Year-6 | Year-7 | Year-8 | Year-9 |
|---|---|---|---|---|---|---|---|---|---|---|
| 1990's | -23,206 | -28,616 | 82,844 | 18,423 | -49,929 | 20,650 | ||||
| 2000's | 87,535 | -108,544 | 6,061 | 16,905 | -33,411 | -6,052 | -9,935 | -2,132 | -3,731 | -65,419 |
| 2010's | -19,131 | -8,535 | -74,234 | 119,255 | -40,011 |
| - = No Data Reported; -- = Not Applicable; NA = Not Available; W = Withheld to avoid disclosure of individual company data. |
| Release Date: 6/30/2026 |
| Next Release Date: 7/31/2026 |