|
Download Data (XLS File) |
|
||||||||
|
||||||||
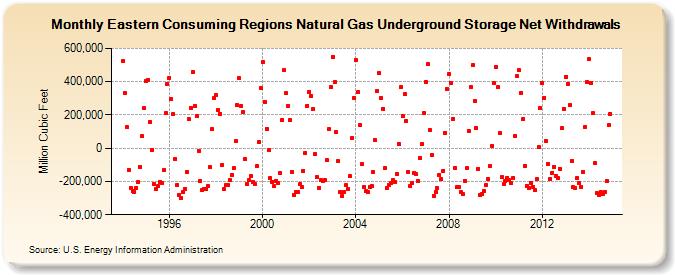
| Eastern Consuming Regions Natural Gas Underground Storage Net Withdrawals (Million Cubic Feet) | ||||||||
| Year | Jan | Feb | Mar | Apr | May | Jun | Jul | Aug | Sep | Oct | Nov | Dec |
|---|---|---|---|---|---|---|---|---|---|---|---|---|
| 1994 | 522,879 | 331,173 | 124,912 | -130,593 | -238,756 | -257,820 | -260,791 | -239,448 | -202,316 | -111,484 | 72,027 | 239,868 |
| 1995 | 406,337 | 409,183 | 160,222 | -9,242 | -215,146 | -246,282 | -229,634 | -202,997 | -210,670 | -134,133 | 209,977 | 386,661 |
| 1996 | 423,704 | 294,292 | 204,119 | -64,083 | -220,759 | -281,537 | -300,612 | -265,082 | -242,746 | -141,841 | 173,946 | 240,936 |
| 1997 | 458,719 | 253,097 | 193,362 | -16,545 | -195,364 | -253,685 | -243,499 | -246,626 | -228,461 | -113,251 | 112,710 | 299,061 |
| 1998 | 317,949 | 231,479 | 208,491 | -102,134 | -246,072 | -223,109 | -219,439 | -191,819 | -162,103 | -120,349 | 41,592 | 259,459 |
| 1999 | 419,150 | 252,359 | 217,813 | -67,439 | -215,308 | -194,151 | -167,850 | -202,059 | -213,208 | -108,825 | 35,337 | 360,730 |
| 2000 | 519,219 | 279,564 | 117,235 | -9,473 | -182,207 | -201,190 | -229,737 | -195,064 | -209,087 | -152,040 | 170,818 | 468,171 |
| 2001 | 329,781 | 255,892 | 168,313 | -141,471 | -280,526 | -263,754 | -265,806 | -217,442 | -233,897 | -135,210 | -28,361 | 255,322 |
| 2002 | 340,645 | 314,811 | 234,915 | -37,612 | -176,236 | -237,723 | -193,939 | -194,332 | -192,240 | -73,011 | 113,556 | 366,511 |
| 2003 | 550,127 | 398,812 | 94,888 | -79,310 | -264,428 | -287,249 | -264,002 | -224,118 | -248,170 | -170,116 | 61,302 | 303,878 |
| 2004 | 528,377 | 338,687 | 140,592 | -97,352 | -232,090 | -259,057 | -265,322 | -234,156 | -228,600 | -144,272 | 47,436 | 344,476 |
| 2005 | 449,801 | 300,712 | 238,295 | -118,590 | -237,160 | -222,495 | -211,234 | -192,450 | -201,593 | -156,528 | 26,743 | 366,999 |
| 2006 | 191,787 | 324,742 | 164,586 | -140,440 | -230,340 | -207,567 | -148,190 | -157,505 | -195,289 | -59,447 | 27,129 | 212,482 |
| 2007 | 400,192 | 503,738 | 109,640 | -41,951 | -285,110 | -263,331 | -241,297 | -161,476 | -186,803 | -136,287 | 92,898 | 357,358 |
| 2008 | 446,639 | 391,073 | 177,516 | -117,040 | -235,579 | -234,026 | -260,647 | -278,010 | -194,851 | -122,097 | 105,067 | 365,647 |
| 2009 | 498,871 | 283,876 | 122,004 | -122,903 | -281,380 | -274,676 | -259,409 | -221,117 | -186,615 | -106,581 | 12,493 | 390,117 |
| 2010 | 487,771 | 365,792 | 88,680 | -173,061 | -214,218 | -200,212 | -177,244 | -193,743 | -212,224 | -178,216 | 72,586 | 431,410 |
| 2011 | 467,384 | 333,153 | 173,383 | -107,998 | -224,857 | -237,471 | -206,658 | -230,487 | -253,299 | -186,589 | 5,604 | 241,188 |
| 2012 | 389,298 | 304,280 | 42,321 | -93,018 | -185,264 | -146,611 | -111,303 | -165,490 | -180,713 | -122,601 | 119,733 | 238,090 |
| 2013 | 430,509 | 386,512 | 258,966 | -74,539 | -234,279 | -240,373 | -180,680 | -211,420 | -230,790 | -142,389 | 129,280 | 399,182 |
| 2014 | 536,009 | 394,079 | 209,159 | -87,884 | -270,157 | -281,325 | -261,830 | -273,214 | -265,508 | -197,968 | 136,650 | 208,273 |
| - = No Data Reported; -- = Not Applicable; NA = Not Available; W = Withheld to avoid disclosure of individual company data. |
| Release Date: 6/30/2026 |
| Next Release Date: 7/31/2026 |