|
Download Data (XLS File) |
|
||||||||
|
||||||||
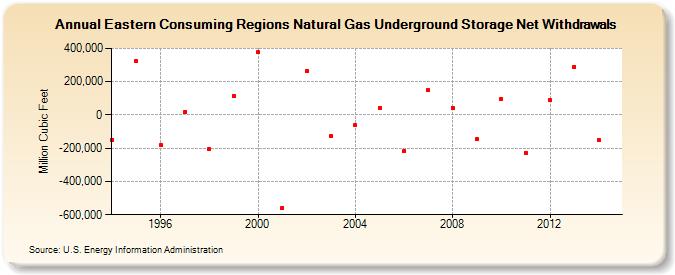
| Eastern Consuming Regions Natural Gas Underground Storage Net Withdrawals (Million Cubic Feet) | ||||||||
| Decade | Year-0 | Year-1 | Year-2 | Year-3 | Year-4 | Year-5 | Year-6 | Year-7 | Year-8 | Year-9 |
|---|---|---|---|---|---|---|---|---|---|---|
| 1990's | -149,894 | 323,014 | -179,663 | 19,518 | -206,056 | 116,549 | ||||
| 2000's | 376,207 | -557,160 | 265,345 | -128,386 | -61,278 | 42,500 | -218,051 | 147,569 | 43,693 | -145,319 |
| 2010's | 97,323 | -226,647 | 88,721 | 289,978 | -153,715 |
| - = No Data Reported; -- = Not Applicable; NA = Not Available; W = Withheld to avoid disclosure of individual company data. |
| Release Date: 6/30/2026 |
| Next Release Date: 7/31/2026 |