|
Download Data (XLS File) |
|
||||||||
|
||||||||
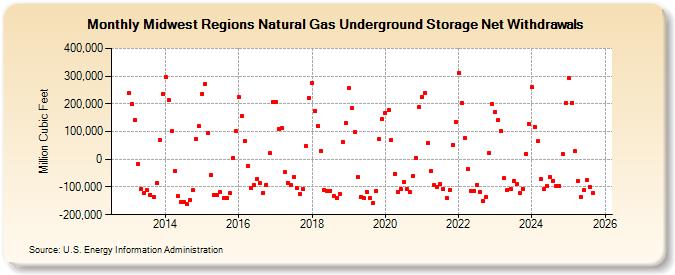
| Midwest Regions Natural Gas Underground Storage Net Withdrawals (Million Cubic Feet) | ||||||||
| Year | Jan | Feb | Mar | Apr | May | Jun | Jul | Aug | Sep | Oct | Nov | Dec |
|---|---|---|---|---|---|---|---|---|---|---|---|---|
| 2013 | 238,975 | 198,788 | 141,997 | -15,729 | -107,402 | -121,723 | -112,483 | -127,403 | -134,759 | -86,392 | 71,174 | 236,027 |
| 2014 | 296,063 | 212,159 | 102,669 | -41,683 | -133,848 | -154,212 | -153,935 | -163,132 | -147,193 | -111,005 | 74,778 | 118,280 |
| 2015 | 236,494 | 272,757 | 93,527 | -56,605 | -129,116 | -127,539 | -118,838 | -139,118 | -141,069 | -123,064 | 3,543 | 102,665 |
| 2016 | 224,000 | 156,470 | 65,327 | -22,774 | -105,382 | -92,831 | -70,923 | -86,571 | -121,381 | -91,550 | 21,114 | 206,299 |
| 2017 | 206,754 | 109,443 | 112,250 | -47,188 | -84,366 | -92,960 | -62,755 | -104,928 | -124,569 | -107,955 | 46,603 | 221,285 |
| 2018 | 275,168 | 172,464 | 119,395 | 29,630 | -110,707 | -116,013 | -112,753 | -133,497 | -141,382 | -125,358 | 63,655 | 131,047 |
| 2019 | 255,741 | 184,242 | 97,575 | -64,436 | -134,577 | -140,701 | -116,940 | -139,105 | -157,129 | -113,626 | 72,749 | 143,932 |
| 2020 | 167,404 | 175,994 | 69,956 | -51,393 | -117,228 | -107,308 | -80,391 | -107,687 | -118,369 | -60,674 | 5,441 | 189,469 |
| 2021 | 225,123 | 239,390 | 58,887 | -43,396 | -93,834 | -98,381 | -90,582 | -107,376 | -138,282 | -110,236 | 52,392 | 135,798 |
| 2022 | 311,636 | 203,900 | 78,082 | -35,790 | -114,937 | -113,041 | -91,354 | -118,866 | -149,745 | -136,908 | 23,342 | 198,961 |
| 2023 | 171,099 | 142,043 | 103,245 | -68,312 | -109,266 | -106,335 | -79,007 | -90,450 | -122,299 | -106,462 | 20,625 | 127,729 |
| 2024 | 259,449 | 117,607 | 64,725 | -70,432 | -107,466 | -95,971 | -63,843 | -76,955 | -97,869 | -97,212 | 19,198 | 202,989 |
| 2025 | 294,746 | 204,664 | 28,194 | -78,488 | -136,596 | -111,594 | -73,418 | -99,146 | -122,085 | -111,538 | 30,286 | 238,128 |
| 2026 | 271,089 | 169,236 | 38,137 | -92,816 | ||||||||
| - = No Data Reported; -- = Not Applicable; NA = Not Available; W = Withheld to avoid disclosure of individual company data. |
| Release Date: 6/30/2026 |
| Next Release Date: 7/31/2026 |