|
Download Data (XLS File) |
|
||||||||
|
||||||||
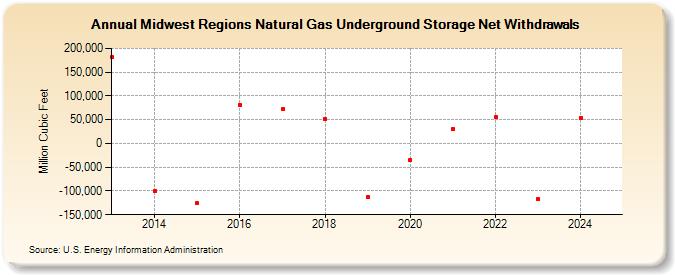
| Midwest Regions Natural Gas Underground Storage Net Withdrawals (Million Cubic Feet) | ||||||||
| Decade | Year-0 | Year-1 | Year-2 | Year-3 | Year-4 | Year-5 | Year-6 | Year-7 | Year-8 | Year-9 |
|---|---|---|---|---|---|---|---|---|---|---|
| 2010's | 181,071 | -101,059 | -126,362 | 81,797 | 71,612 | 51,647 | -112,275 | |||
| 2020's | -34,785 | 29,505 | 55,280 | -117,391 | 54,219 | 63,152 |
| - = No Data Reported; -- = Not Applicable; NA = Not Available; W = Withheld to avoid disclosure of individual company data. |
| Release Date: 6/30/2026 |
| Next Release Date: 7/31/2026 |